Bank of America 2010 Annual Report Download - page 186
Download and view the complete annual report
Please find page 186 of the 2010 Bank of America annual report below. You can navigate through the pages in the report by either clicking on the pages listed below, or by using the keyword search tool below to find specific information within the annual report.-
 1
1 -
2
-
3
-
4
-
5
-
6
-
7
-
8
-
9
-
10
-
11
-
12
-
13
-
14
-
15
-
16
-
17
-
18
-
19
-
20
-
21
-
22
-
23
-
24
-
25
-
26
-
27
-
28
-
29
-
30
-
31
-
32
-
33
-
34
-
35
-
36
-
37
-
38
-
39
-
40
-
41
-
42
-
43
-
44
-
45
-
46
-
47
-
48
-
49
-
50
-
51
-
52
-
53
-
54
-
55
-
56
-
57
-
58
-
59
-
60
-
61
-
62
-
63
-
64
-
65
-
66
-
67
-
68
-
69
-
70
-
71
-
72
-
73
-
74
-
75
-
76
-
77
-
78
-
79
-
80
-
81
-
82
-
83
-
84
-
85
-
86
-
87
-
88
-
89
-
90
-
91
-
92
-
93
-
94
-
95
-
96
-
97
-
98
-
99
-
100
-
101
-
102
-
103
-
104
-
105
-
106
-
107
-
108
-
109
-
110
-
111
-
112
-
113
-
114
-
115
-
116
-
117
-
118
-
119
-
120
-
121
-
122
-
123
-
124
-
125
-
126
-
127
-
128
-
129
-
130
-
131
-
132
-
133
-
134
-
135
-
136
-
137
-
138
-
139
-
140
-
141
-
142
-
143
-
144
-
145
-
146
-
147
-
148
-
149
-
150
-
151
-
152
-
153
-
154
-
155
-
156
-
157
-
158
-
159
-
160
-
161
-
162
-
163
-
164
-
165
-
166
-
167
-
168
-
169
-
170
-
171
-
172
-
173
-
174
-
175
-
 176
176 -
 177
177 -
 178
178 -
 179
179 -
 180
180 -
 181
181 -
 182
182 -
 183
183 -
 184
184 -
 185
185 -
 186
186 -
 187
187 -
 188
188 -
 189
189 -
 190
190 -
 191
191 -
 192
192 -
 193
193 -
 194
194 -
 195
195 -
 196
196 -
197
-
198
-
199
-
200
-
201
-
202
-
203
-
204
-
205
-
206
-
207
-
208
-
209
-
210
-
211
-
212
-
213
-
214
-
215
-
216
-
217
-
218
-
219
-
220
-
221
-
222
-
223
-
224
-
225
-
226
-
227
-
228
-
229
-
230
-
231
-
232
-
233
-
234
-
235
-
236
-
237
-
238
-
239
-
240
-
241
-
242
-
243
-
244
-
245
-
246
-
247
-
248
-
249
-
250
-
251
-
252
 |
 |

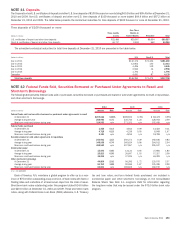
Collateralized Debt Obligation Vehicles
CDO vehicles hold diversified pools of fixed-income securities, typically cor-
porate debt or asset-backed securities, which they fund by issuing multiple
tranches of debt and equity securities. Synthetic CDOs enter into a portfolio of
credit default swaps to synthetically create exposure to fixed-income securi-
ties. CLOs are a subset of CDOs which hold pools of loans, typically corporate
loans or commercial mortgages. CDOs are typically managed by third-party
portfolio managers. The Corporation transfers assets to these CDOs, holds
securities issued by the CDOs and may be a derivative counterparty to the
CDOs, including a credit default swap counterparty for synthetic CDOs. The
Corporation has also entered into total return swaps with certain CDOs
whereby the Corporation absorbs the economic returns generated by spec-
ified assets held by the CDO. The Corporation receives fees for structuring
CDOs and providing liquidity support for super senior tranches of securities
issued by certain CDOs. No third parties provide a significant amount of
similar commitments to these CDOs.
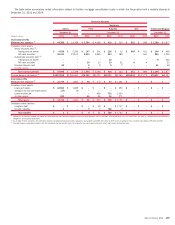
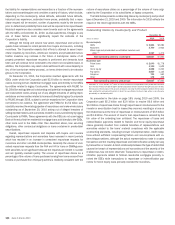
The table below summarizes select information related to CDO vehicles in
which the Corporation held a variable interest at December 31, 2010 and
2009.
(Dollars in millions)
Consolidated Unconsolidated Total Consolidated Unconsolidated Total
2010 2009
December 31
Maximum loss exposure
(1)
$2,971 $ 3,828 $ 6,799
$3,863 $ 6,987 $10,850
On-balance sheet assets
Trading account assets
$2,485 $ 884 $ 3,369
$2,785 $ 1,253 $ 4,038
Derivative assets
207 890 1,097
– 2,085 2,085
Available-for-sale debt securities
769 338 1,107
1,414 368 1,782
All other assets
24 123 147
– 166 166
Total
$3,485 $ 2,235 $ 5,720
$4,199 $ 3,872 $ 8,071
On-balance sheet liabilities
Derivative liabilities
$– $58$58
$– $781$781
Long-term debt
3,162 – 3,162
2,753 – 2,753
Total
$3,162 $ 58 $ 3,220
$2,753 $ 781 $ 3,534
Total assets of VIEs
$3,485 $43,476 $46,961
$4,199 $56,590 $60,789
(1)
Maximum loss exposure is net of credit protection purchased from the CDO with which the Corporation has involvement but has not been reduced to reflect the benefit of insurance purchased from other third parties.
The Corporation’s maximum loss exposure of $6.8 billion at December 31,
2010 includes $1.8 billion of super senior CDO exposure, $2.2 billion of
exposure to CDO financing facilities and $2.8 billion of other non-super senior
exposure. This exposure is calculated on a gross basis and does not reflect
any benefit from insurance purchased from third parties other than the CDO
itself. Net of purchased insurance but including securities retained from
liquidations of CDOs, the Corporation’s net exposure to super senior CDO-
related positions was $1.2 billion at December 31, 2010. The CDO financing
facilities, which are consolidated, obtain funding from third parties for CDO
positions which are principally classified in trading account assets on the
Corporation’s Consolidated Balance Sheet. The CDO financing facilities’ long-
term debt at December 31, 2010 totaled $2.6 billion, all of which has
recourse to the general credit of the Corporation.
At December 31, 2010, the Corporation had $951 million notional amount
of super senior CDO liquidity exposure, including derivatives and other expo-
sures with third parties that hold super senior cash positions on the Corpo-
ration’s behalf and to certain synthetic CDOs through which the Corporation is
obligated to purchase super senior CDO securities at par value if the CDOs
need cash to make payments due under credit default swaps written by the
CDO vehicles. Liquidity-related commitments also include $1.7 billion notional
amount of derivative contracts with unconsolidated special purpose entities
(SPEs), principally CDO vehicles, which hold non-super senior CDO debt
securities or other debt securities on the Corporation’s behalf. These deriv-
atives comprise substantially all of the $1.7 billion notional amount of deriv-
ative contracts through which the Corporation obtains funding from third-party
SPEs, as described in Note 14 – Commitments and Contingencies. The
Corporation’s $2.7 billion of aggregate liquidity exposure to CDOs at Decem-
ber 31, 2010 is included in the table above to the extent that the Corporation
sponsored the CDO vehicle or the liquidity exposure is more than insignificant
compared to total assets of the CDO vehicle. Liquidity exposure included in
the table is reported net of previously recorded losses.
The Corporation’s maximum exposure to loss is significantly less than the
total assets of the CDO vehicles in the table above because the Corporation
typically has exposure to only a portion of the total assets. The Corporation
has also purchased credit protection from some of the same CDO vehicles in
which it invested, thus reducing the Corporation’s maximum exposure to loss.
184 Bank of America 2010