Bank of America 2010 Annual Report Download - page 194
Download and view the complete annual report
Please find page 194 of the 2010 Bank of America annual report below. You can navigate through the pages in the report by either clicking on the pages listed below, or by using the keyword search tool below to find specific information within the annual report.-
 1
1 -
2
-
3
-
4
-
5
-
6
-
7
-
8
-
9
-
10
-
11
-
12
-
13
-
14
-
15
-
16
-
17
-
18
-
19
-
20
-
21
-
22
-
23
-
24
-
25
-
26
-
27
-
28
-
29
-
30
-
31
-
32
-
33
-
34
-
35
-
36
-
37
-
38
-
39
-
40
-
41
-
42
-
43
-
44
-
45
-
46
-
47
-
48
-
49
-
50
-
51
-
52
-
53
-
54
-
55
-
56
-
57
-
58
-
59
-
60
-
61
-
62
-
63
-
64
-
65
-
66
-
67
-
68
-
69
-
70
-
71
-
72
-
73
-
74
-
75
-
76
-
77
-
78
-
79
-
80
-
81
-
82
-
83
-
84
-
85
-
86
-
87
-
88
-
89
-
90
-
91
-
92
-
93
-
94
-
95
-
96
-
97
-
98
-
99
-
100
-
101
-
102
-
103
-
104
-
105
-
106
-
107
-
108
-
109
-
110
-
111
-
112
-
113
-
114
-
115
-
116
-
117
-
118
-
119
-
120
-
121
-
122
-
123
-
124
-
125
-
126
-
127
-
128
-
129
-
130
-
131
-
132
-
133
-
134
-
135
-
136
-
137
-
138
-
139
-
140
-
141
-
142
-
143
-
144
-
145
-
146
-
147
-
148
-
149
-
150
-
151
-
152
-
153
-
154
-
155
-
156
-
157
-
158
-
159
-
160
-
161
-
162
-
163
-
164
-
165
-
166
-
167
-
168
-
169
-
170
-
171
-
172
-
173
-
174
-
175
-
176
-
177
-
178
-
179
-
180
-
181
-
182
-
183
-
 184
184 -
 185
185 -
 186
186 -
 187
187 -
 188
188 -
 189
189 -
 190
190 -
 191
191 -
 192
192 -
 193
193 -
 194
194 -
 195
195 -
 196
196 -
 197
197 -
 198
198 -
 199
199 -
 200
200 -
 201
201 -
 202
202 -
 203
203 -
 204
204 -
205
-
206
-
207
-
208
-
209
-
210
-
211
-
212
-
213
-
214
-
215
-
216
-
217
-
218
-
219
-
220
-
221
-
222
-
223
-
224
-
225
-
226
-
227
-
228
-
229
-
230
-
231
-
232
-
233
-
234
-
235
-
236
-
237
-
238
-
239
-
240
-
241
-
242
-
243
-
244
-
245
-
246
-
247
-
248
-
249
-
250
-
251
-
252
 |
 |

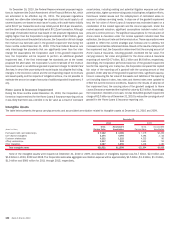
On December 16, 2010, the Federal Reserve released proposed regula-
tions to implement the Durbin Amendment of the Financial Reform Act, which
are scheduled to be effective July 21, 2011. The proposed regulations
included two alternative interchange fee standards that would apply to all
covered issuers: one based on each issuer’s costs, with a safe harbor initially
set at $0.07 per transaction and a cap initially set at $0.12 per transaction,
and the other a stand-alone cap initially set at $0.12 per transaction. Although
the range of estimated revenue loss based on the proposed regulations was
slightly higher than the Corporation’s original estimate of $2.0 billion, given
the uncertainty around the potential outcome, the Corporation did not change
the revenue loss estimate used in the goodwill impairment test during the
three months ended December 31, 2010. If the final Federal Reserve rule
sets interchange fee standards that are significantly lower than the inter-
change fee assumptions the Corporation used in this goodwill impairment
test, the Corporation will be required to perform an additional goodwill
impairment test. If the final interchange fee standards are at the lowest
proposed fee alternative, the Corporation’s current estimate of the revenue
loss could result in an additional goodwill impairment charge for Global Card
Services. In view of the uncertainty with model inputs including the final ruling,
changes in the economic outlook and the corresponding impact to revenues
and asset quality, and the impacts of mitigation actions, it is not possible to
estimate the amount or range of amounts of additional goodwill impairment, if
any.
Home Loans & Insurance Impairment
During the three months ended December 31, 2010, the Corporation per-
formed an impairment test for the Home Loans & Insurance reporting unit as
it was likely that there was a decline in its fair value as a result of increased
uncertainties, including existing and potential litigation exposure and other
potential risks, higher current servicing costs including loss mitigation efforts,
foreclosure related issues and the redeployment of centralized sales re-
sources to address servicing needs. In step one of the goodwill impairment
test, the fair value of Home Loans & Insurance was estimated based on a
combination of the market approach and the income approach. Under the
market approach valuation, significant assumptions included market multi-
ples and a control premium. The significant assumptions for the valuation of
Home Loans & Insurance under the income approach included cash flow
estimates, the discount rate and the terminal value. These assumptions were
updated to reflect the current strategic plan forecast and to address the
increased uncertainties referenced above. Based on the results of step one of
the impairment test,the Corporation determined that the carrying amount of
Home Loans & Insurance, including goodwill, exceeded the fair value. The
carrying amount, fair value and goodwill for the Home Loans & Insurance
reporting unit were $24.7 billion, $15.1 billion and $4.8 billion, respectively.
Accordingly, the Corporation performed step two of the goodwill impairment
test for this reporting unit. In step two, the Corporation compared the implied
fair value of the reporting unit’s goodwill with the carrying amount of that
goodwill. Under step two of the goodwill impairment test, significant assump-
tions in measuring the fair value of the assets and liabilities of the reporting
unit including discount rates, loss rates and interest rates were updated to
reflect the current economic conditions. Based on the results of step two of
the impairment test, the carrying value of the goodwill assigned to Home
Loans & Insurance exceeded the implied fair value by $2.0 billion. Accordingly,
the Corporation recorded a non-cash, non-tax deductible goodwill impairment
charge of $2.0 billion as of December 31, 2010 to reduce the carrying value of
goodwill in the Home Loans & Insurance reporting unit.
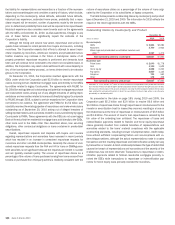
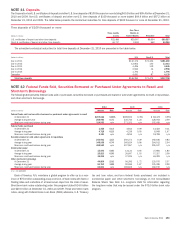
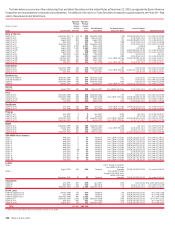
Intangible Assets
The table below presents the gross carrying amounts and accumulated amortization related to intangible assets at December 31, 2010 and 2009.
(Dollars in millions)
Gross
Carrying Value
Accumulated
Amortization
Gross
Carrying Value
Accumulated
Amortization
2010 2009
December 31
Purchased credit card relationships
$7,162 $4,085
$ 7,179 $3,452
Core deposit intangibles
5,394 4,094
5,394 3,722
Customer relationships
4,232 1,222
4,232 760
Affinity relationships
1,647 902
1,651 751
Other intangibles
3,087 1,296
3,438 1,183
Total intangible assets
$21,522 $11,599
$21,894 $9,868
None of the intangible assets were impaired at December 31, 2010 or 2009. Amortization of intangibles expense was $1.7 billion, $2.0 billion and
$1.8 billion in 2010, 2009 and 2008. The Corporation estimates aggregate amortization expense will be approximately $1.5 billion, $1.3 billion, $1.2 billion,
$1.0 billion and $900 million for 2011 through 2015, respectively.
192 Bank of America 2010