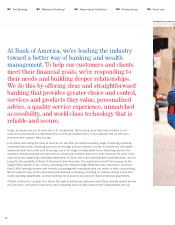
Bank of America 2010 Annual Report Download - page 7
Download and view the complete annual report
Please find page 7 of the 2010 Bank of America annual report below. You can navigate through the pages in the report by either clicking on the pages listed below, or by using the keyword search tool below to find specific information within the annual report.-
 1
1 -
 2
2 -
 3
3 -
 4
4 -
 5
5 -
 6
6 -
 7
7 -
 8
8 -
 9
9 -
 10
10 -
 11
11 -
 12
12 -
 13
13 -
 14
14 -
 15
15 -
 16
16 -
 17
17 -
 18
18 -
19
-
20
-
21
-
22
-
23
-
24
-
25
-
26
-
27
-
28
-
29
-
30
-
31
-
32
-
33
-
34
-
35
-
36
-
37
-
38
-
39
-
40
-
41
-
42
-
43
-
44
-
45
-
46
-
47
-
48
-
49
-
50
-
51
-
52
-
53
-
54
-
55
-
56
-
57
-
58
-
59
-
60
-
61
-
62
-
63
-
64
-
65
-
66
-
67
-
68
-
69
-
70
-
71
-
72
-
73
-
74
-
75
-
76
-
77
-
78
-
79
-
80
-
81
-
82
-
83
-
84
-
85
-
86
-
87
-
88
-
89
-
90
-
91
-
92
-
93
-
94
-
95
-
96
-
97
-
98
-
99
-
100
-
101
-
102
-
103
-
104
-
105
-
106
-
107
-
108
-
109
-
110
-
111
-
112
-
113
-
114
-
115
-
116
-
117
-
118
-
119
-
120
-
121
-
122
-
123
-
124
-
125
-
126
-
127
-
128
-
129
-
130
-
131
-
132
-
133
-
134
-
135
-
136
-
137
-
138
-
139
-
140
-
141
-
142
-
143
-
144
-
145
-
146
-
147
-
148
-
149
-
150
-
151
-
152
-
153
-
154
-
155
-
156
-
157
-
158
-
159
-
160
-
161
-
162
-
163
-
164
-
165
-
166
-
167
-
168
-
169
-
170
-
171
-
172
-
173
-
174
-
175
-
176
-
177
-
178
-
179
-
180
-
181
-
182
-
183
-
184
-
185
-
186
-
187
-
188
-
189
-
190
-
191
-
192
-
193
-
194
-
195
-
196
-
197
-
198
-
199
-
200
-
201
-
202
-
203
-
204
-
205
-
206
-
207
-
208
-
209
-
210
-
211
-
212
-
213
-
214
-
215
-
216
-
217
-
218
-
219
-
220
-
221
-
222
-
223
-
224
-
225
-
226
-
227
-
228
-
229
-
230
-
231
-
232
-
233
-
234
-
235
-
236
-
237
-
238
-
239
-
240
-
241
-
242
-
243
-
244
-
245
-
246
-
247
-
248
-
249
-
250
-
251
-
252
 |
 |
5
* Fully taxable-equivalent basis
100908
$2,263
$5,551
$5,520
$17,625
$17,303
$(6,882)
100908
$17,625
$17,303
100908
2.93%
5.56%
5.99%
100908
$2,263
$5,551
$5,520
$17,625
$17,303
$(6,882)
100908
$17,625
$17,303
100908
2.93%
5.56%
5.99%
that company. We continue to work toward an appropriate resolution of repurchase claims
held by private investors and monoline insurers.
It is important to the economic recovery that the housing market stabilizes. That will require
moving through the modification and foreclosure process quickly but carefully. We took
an important step in this direction in creating a new Legacy Asset Servicing group, which
includes responsibility for residential mortgage repurchase claims and management of
default servicing. This change will clear the way for leaders in our Home Loans business to
focus on building the leading mortgage origination business in the country.
In addition to mitigating mortgage issues, we also reduced certain capital markets risk expo-
sures that were originated prior to the downturn to $23 billion in 2010.
Be the best place for people to work We want to be the best place for our teammates to
achieve their professional goals, while helping build the world’s finest financial services
company for our customers and shareholders.
To meet this goal, we are aligning our training, reward and recognition programs to our
customer strategy. We made changes to our benefits programs to make health care cover-
age more affordable for most of our employees; and, we continued to strengthen our leading
diversity and inclusion programs to ensure that every member of our team can achieve his
or her potential. We also conducted a company-wide employee survey (95 percent of our
employees participated) that led to valuable feedback about what we can do to build an even
more engaging workplace.
Focused on the Future
Our 2010 results show that, while we have made progress in strengthening the balance
sheet and focusing our capital to support core capabilities for customers, the overhang of
issues related to recent acquisitions and regulatory changes remained significant. Excluding
two non-cash, non-tax deductible goodwill impairment charges, we earned $10.2 billion for
the full year. Including these charges, we posted a net loss of $2.2 billion.
Even so, the underlying results show the strength and promise of the company. Credit
costs fell, resulting in a reduction of provision expense to $28.4 billion from $48.6 billion
in 2009. Deposit balances reached a record $1 trillion at the end of the year, showing that
customers continue to see our company as a trusted and stable partner. And referrals
among our businesses are increasing, demonstrating the power of our relationship-based,
customer-centered strategy.
As I wrote above, our company is much stronger today than it was a year ago, as we made
tough decisions in 2010 aimed at putting issues related to the recession behind us. We have
the number one or number two market position in almost every business in which we choose
to compete. We serve millions of consumers, businesses and institutional investors, each
of which provides an opportunity for us to expand our relationship with them. We are leaving
nothing to chance in our efforts to pursue these opportunities.
For your additional information, we have posted presentations from a recent all-day investor
conference in New York at which members of our management team and I discussed in detail
the items I’ve outlined here. I encourage you to view the presentations in the investor section
of our public website at http://investor.bankofamerica.com.
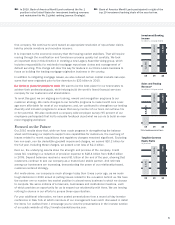
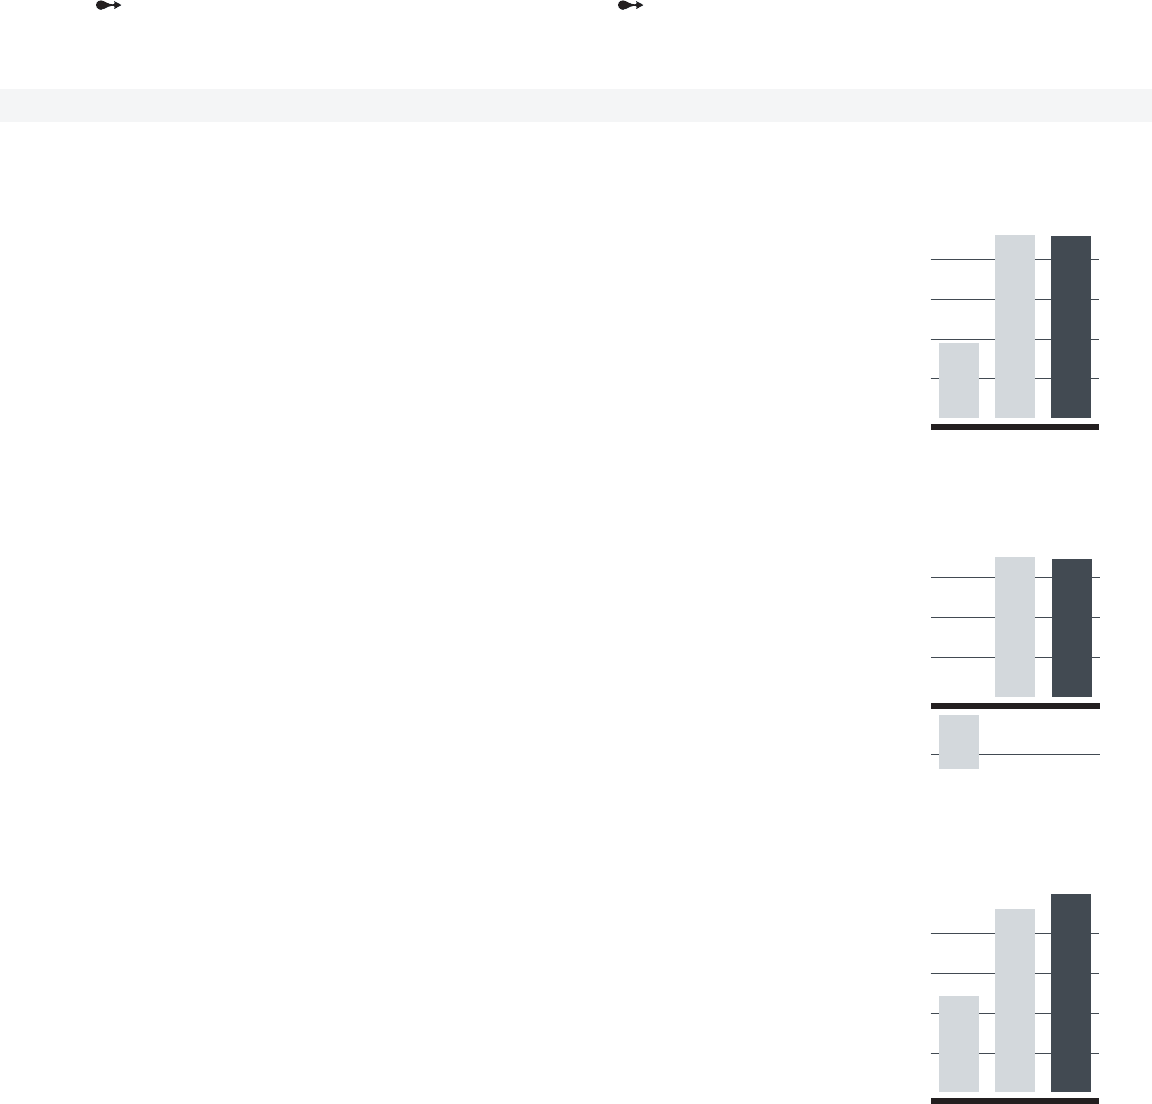
Investment Banking
Income
In millions, full-year ended
Sales and Trading
Revenue*
In millions, full-year ended
* Fully taxable-equivalent basis
Tangible Common
Equity Ratio
At year end
In 2010, Bank of America Merrill Lynch achieved the No. 1
position in the United States for investment banking revenues
and maintained its No. 2 global ranking (source: Dealogic).
Bank of America Merrill Lynch participated in eight of the
top 10 investment banking deals of the year by fees.