Bank of America 2010 Annual Report Download - page 162
Download and view the complete annual report
Please find page 162 of the 2010 Bank of America annual report below. You can navigate through the pages in the report by either clicking on the pages listed below, or by using the keyword search tool below to find specific information within the annual report.-
 1
1 -
2
-
3
-
4
-
5
-
6
-
7
-
8
-
9
-
10
-
11
-
12
-
13
-
14
-
15
-
16
-
17
-
18
-
19
-
20
-
21
-
22
-
23
-
24
-
25
-
26
-
27
-
28
-
29
-
30
-
31
-
32
-
33
-
34
-
35
-
36
-
37
-
38
-
39
-
40
-
41
-
42
-
43
-
44
-
45
-
46
-
47
-
48
-
49
-
50
-
51
-
52
-
53
-
54
-
55
-
56
-
57
-
58
-
59
-
60
-
61
-
62
-
63
-
64
-
65
-
66
-
67
-
68
-
69
-
70
-
71
-
72
-
73
-
74
-
75
-
76
-
77
-
78
-
79
-
80
-
81
-
82
-
83
-
84
-
85
-
86
-
87
-
88
-
89
-
90
-
91
-
92
-
93
-
94
-
95
-
96
-
97
-
98
-
99
-
100
-
101
-
102
-
103
-
104
-
105
-
106
-
107
-
108
-
109
-
110
-
111
-
112
-
113
-
114
-
115
-
116
-
117
-
118
-
119
-
120
-
121
-
122
-
123
-
124
-
125
-
126
-
127
-
128
-
129
-
130
-
131
-
132
-
133
-
134
-
135
-
136
-
137
-
138
-
139
-
140
-
141
-
142
-
143
-
144
-
145
-
146
-
147
-
148
-
149
-
150
-
151
-
 152
152 -
 153
153 -
 154
154 -
 155
155 -
 156
156 -
 157
157 -
 158
158 -
 159
159 -
 160
160 -
 161
161 -
 162
162 -
 163
163 -
 164
164 -
 165
165 -
 166
166 -
 167
167 -
 168
168 -
 169
169 -
 170
170 -
 171
171 -
 172
172 -
173
-
174
-
175
-
176
-
177
-
178
-
179
-
180
-
181
-
182
-
183
-
184
-
185
-
186
-
187
-
188
-
189
-
190
-
191
-
192
-
193
-
194
-
195
-
196
-
197
-
198
-
199
-
200
-
201
-
202
-
203
-
204
-
205
-
206
-
207
-
208
-
209
-
210
-
211
-
212
-
213
-
214
-
215
-
216
-
217
-
218
-
219
-
220
-
221
-
222
-
223
-
224
-
225
-
226
-
227
-
228
-
229
-
230
-
231
-
232
-
233
-
234
-
235
-
236
-
237
-
238
-
239
-
240
-
241
-
242
-
243
-
244
-
245
-
246
-
247
-
248
-
249
-
250
-
251
-
252
 |
 |

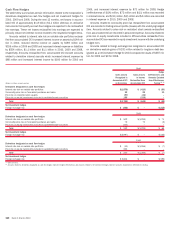
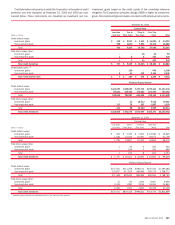
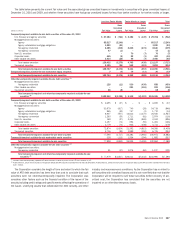
Cash Flow Hedges
The table below summarizes certain information related to the Corporation’s
derivatives designated as cash flow hedges and net investment hedges for
2010, 2009 and 2008. During the next 12 months, net losses in accumu-
lated OCI of approximately $1.8 billion ($1.1 billion after-tax) on derivative
instruments that qualify as cash flow hedges are expected to be reclassified
into earnings. These net losses reclassified into earnings are expected to
primarily reduce net interest income related to the respective hedged items.
Amounts related to interest rate risk on variable rate portfolios reclassi-
fied from accumulated OCI increased interest income on assets by $144 mil-
lion in 2010, reduced interest income on assets by $189 million and
$156 million in 2009 and 2008 and increased interest expense on liabilities
by $554 million, $1.1 billion and $1.1 billion in 2010, 2009 and 2008,
respectively. Amounts reclassified from accumulated OCI exclude amounts
related to derivative interest accruals which increased interest expense by
$88 million and increased interest income by $160 million for 2010 and
2009, and increased interest expense by $73 million for 2008. Hedge
ineffectiveness of $(14) million, $73 million and $(11) million was recorded
in interest income, and $(16) million, $(2) million and $4 million was recorded
in interest expense in 2010, 2009 and 2008.
Amounts related to commodity price risk reclassified from accumulated
OCI are recorded in trading account profits (losses) with the underlying hedged
item. Amounts related to price risk on restricted stock awards reclassified
from accumulated OCI are recorded in personnel expense. Amounts related to
price risk on equity investments included in AFS securities reclassified from
accumulated OCI are recorded in equity investment income with the underlying
hedged item.
Amounts related to foreign exchange risk recognized in accumulated OCI
on derivatives exclude gains of $192 million related to long-term debt des-
ignated as a net investment hedge for 2010 compared to losses of $387 mil-
lion for 2009 and $0 for 2008.
(Dollars in millions, amounts pre-tax)
Gains (losses)
Recognized in
Accumulated OCI
on Derivatives
Gains (losses)
in Income
Reclassified from
Accumulated OCI
Hedge
Ineffectiveness and
Amounts Excluded
from Effectiveness
Testing
(1, 2)
2010
Derivatives designated as cash flow hedges
Interest rate risk on variable rate portfolios
$(1,876) $ (410) $ (30)
Commodity price risk on forecasted purchases and sales
32 25 11
Price risk on restricted stock awards
(97) (33) –
Price risk on equity investments included in available-for-sale securities
186 (226) –
Total $(1,755) $ (644) $ (19)
Net investment hedges
Foreign exchange risk
$ (482) $ – $(315)
2009
Derivatives designated as cash flow hedges
Interest rate risk on variable rate portfolios $ 502 $(1,293) $ 71
Commodity price risk on forecasted purchases and sales 72 70 (2)
Price risk on equity investments included in available-for-sale securities (332) – –
Total
$ 242 $(1,223) $ 69
Net investment hedges
Foreign exchange risk $(2,997) $ – $(142)
2008
Derivatives designated as cash flow hedges
Interest rate risk on variable rate portfolios $ (13) $(1,266) $ (7)
Price risk on equity investments included in available-for-sale securities 243 – –
Total
$ 230 $(1,266) $ (7)
Net investment hedges
Foreign exchange risk $ 2,814 $ – $(192)
(1)
Gains (losses).
(2)
Amounts related to derivatives designated as cash flow hedges represent hedge ineffectiveness and amounts related to net investment hedges represent amounts excluded from effectiveness testing.
160 Bank of America 2010