Bank of America 2010 Annual Report Download - page 105
Download and view the complete annual report
Please find page 105 of the 2010 Bank of America annual report below. You can navigate through the pages in the report by either clicking on the pages listed below, or by using the keyword search tool below to find specific information within the annual report.-
 1
1 -
2
-
3
-
4
-
5
-
6
-
7
-
8
-
9
-
10
-
11
-
12
-
13
-
14
-
15
-
16
-
17
-
18
-
19
-
20
-
21
-
22
-
23
-
24
-
25
-
26
-
27
-
28
-
29
-
30
-
31
-
32
-
33
-
34
-
35
-
36
-
37
-
38
-
39
-
40
-
41
-
42
-
43
-
44
-
45
-
46
-
47
-
48
-
49
-
50
-
51
-
52
-
53
-
54
-
55
-
56
-
57
-
58
-
59
-
60
-
61
-
62
-
63
-
64
-
65
-
66
-
67
-
68
-
69
-
70
-
71
-
72
-
73
-
74
-
75
-
76
-
77
-
78
-
79
-
80
-
81
-
82
-
83
-
84
-
85
-
86
-
87
-
88
-
89
-
90
-
91
-
92
-
93
-
94
-
 95
95 -
 96
96 -
 97
97 -
 98
98 -
 99
99 -
 100
100 -
 101
101 -
 102
102 -
 103
103 -
 104
104 -
 105
105 -
 106
106 -
 107
107 -
 108
108 -
 109
109 -
 110
110 -
 111
111 -
 112
112 -
 113
113 -
 114
114 -
 115
115 -
116
-
117
-
118
-
119
-
120
-
121
-
122
-
123
-
124
-
125
-
126
-
127
-
128
-
129
-
130
-
131
-
132
-
133
-
134
-
135
-
136
-
137
-
138
-
139
-
140
-
141
-
142
-
143
-
144
-
145
-
146
-
147
-
148
-
149
-
150
-
151
-
152
-
153
-
154
-
155
-
156
-
157
-
158
-
159
-
160
-
161
-
162
-
163
-
164
-
165
-
166
-
167
-
168
-
169
-
170
-
171
-
172
-
173
-
174
-
175
-
176
-
177
-
178
-
179
-
180
-
181
-
182
-
183
-
184
-
185
-
186
-
187
-
188
-
189
-
190
-
191
-
192
-
193
-
194
-
195
-
196
-
197
-
198
-
199
-
200
-
201
-
202
-
203
-
204
-
205
-
206
-
207
-
208
-
209
-
210
-
211
-
212
-
213
-
214
-
215
-
216
-
217
-
218
-
219
-
220
-
221
-
222
-
223
-
224
-
225
-
226
-
227
-
228
-
229
-
230
-
231
-
232
-
233
-
234
-
235
-
236
-
237
-
238
-
239
-
240
-
241
-
242
-
243
-
244
-
245
-
246
-
247
-
248
-
249
-
250
-
251
-
252
 |
 |

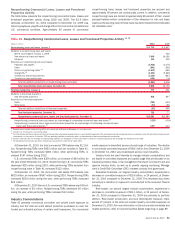
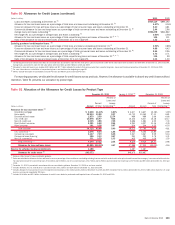
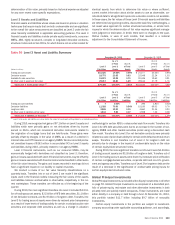
Table 50 Allowance for Credit Losses (continued)
(Dollars in millions)
2010 2009
Loans and leases outstanding at December 31
(5)
$937,119
$895,192
Allowance for loan and lease losses as a percentage of total loans and leases and outstanding at December 31
(5)
4.47%
4.16%
Consumer allowance for loan and lease losses as a percentage of total consumer loans and leases outstanding at December 31
5.40
4.81
Commercial allowance for loan and lease losses as a percentage of total commercial loans and leases outstanding at December 31
(5)
2.44
2.96
Average loans and leases outstanding
(5)
$954,278
$941,862
Net charge-offs as a percentage of average loans and leases outstanding
(5)
3.60%
3.58%
Allowance for loan and lease losses as a percentage of total nonperforming loans and leases at December 31
(5, 6, 7)
136
111
Ratio of the allowance for loan and lease losses at December 31 to net charge-offs
1.22
1.10
Excluding purchased credit-impaired loans:
(8)
Allowance for loan and lease losses as a percentage of total loans and leases outstanding at December 31
(5)
3.94%
3.88%
Consumer allowance for loan and lease losses as a percentage of total consumer loans and leases outstanding at December 31
4.66
4.43
Commercial allowance for loan and lease losses as a percentage of total commercial loans and leases outstanding at December 31
(5)
2.44
2.96
Net charge-offs as a percentage of average loans and leases outstanding
(5)
3.73
3.71
Allowance for loan and lease losses as a percentage of total nonperforming loans and leases at December 31
(5, 6, 7)
116
99
Ratio of the allowance for loan and lease losses at December 31 to net charge-offs
1.04
1.00
(5)
Outstanding loan and lease balances and ratios do not include loans accounted for under the fair value option. Loans accounted for under the fair value option were $3.3 billion and $4.9 billion at December 31, 2010 and 2009.
Average loans accounted for under the fair value option were $4.1 billion and $6.9 billion in 2010 and 2009.
(6)
Allowance for loan and lease losses includes $22.9 billion and $17.7 billion allocated to products that were excluded from nonperforming loans, leases and foreclosed properties at December 31, 2010 and 2009.
(7)
For more information on our definition of nonperforming loans, see the discussion beginning on page 85.
(8)
Metrics exclude the impact of Countrywide consumer PCI loans and Merrill Lynch commercial PCI loans.
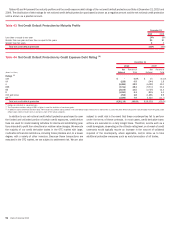
For reporting purposes, we allocate the allowance for credit losses across products. However, the allowance is available to absorb any credit losses without
restriction. Table 51 presents our allocation by product type.
Table 51 Allocation of the Allowance for Credit Losses by Product Type
(Dollars in millions)
Amount
Percent
of Total
Percent of
Loans and
Leases
Outstanding
(2)
Amount Amount
Percent of
Total
Percent of
Loans and
Leases
Outstanding
(2)
December 31, 2010 January 1, 2010
(1)
December 31, 2009
Allowance for loan and lease losses
(3)
Residential mortgage
$ 4,648 11.10% 1.80%
$ 4,607 $ 4,607 12.38% 1.90%
Home equity
12,934 30.88 9.37
10,733 10,160 27.31 6.81
Discontinued real estate
1,670 3.99 12.74
989 989 2.66 6.66
U.S. credit card
10,876 25.97 9.56
15,102 6,017 16.18 12.17
Non-U.S. credit card
2,045 4.88 7.45
2,686 1,581 4.25 7.30
Direct/Indirect consumer
2,381 5.68 2.64
4,251 4,227 11.36 4.35
Other consumer
161 0.38 5.67
204 204 0.55 6.53
Total consumer
34,715 82.88 5.40
38,572 27,785 74.69 4.81
U.S. commercial
(4)
3,576 8.54 1.88
5,153 5,152 13.85 2.59
Commercial real estate
3,137 7.49 6.35
3,567 3,567 9.59 5.14
Commercial lease financing
126 0.30 0.57
291 291 0.78 1.31
Non-U.S. commercial
331 0.79 1.03
405 405 1.09 1.50
Total commercial
(5)
7,170 17.12 2.44
9,416 9,415 25.31 2.96
Allowance for loan and lease losses
41,885 100.00% 4.47
47,988 37,200 100.00% 4.16
Reserve for unfunded lending commitments
1,188
1,487 1,487
Allowance for credit losses
(6)
$43,073
$49,475 $38,687
(1)
Balances reflect impact of new consolidation guidance.
(2)
Ratios are calculated as allowance for loan and lease losses as a percentage of loans and leases outstanding excluding loans accounted for under the fair value option for each loan and lease category. Loans accounted for under the
fair value option include U.S. commercial loans of $1.6 billion and $3.0 billion, non-U.S. commercial loans of $1.7 billion and $1.9 billion and commercial real estate loans of $79 million and $90 million at December 31, 2010 and
2009.
(3)
December 31, 2010 is presented in accordance with new consolidation guidance. December 31, 2009 has not been restated.
(4)
Includes allowance for U.S. small business commercial loans of $1.5 billion and $2.4 billion at December 31, 2010 and 2009.
(5)
Includes allowance for loan and lease losses for impaired commercial loans of $1.1 billion and $1.2 billion at December 31, 2010 and 2009. Included in the $1.1 billion at December 31, 2010 is $445 million related to U.S. small
business commercial renegotiated TDR loans.
(6)
Includes $6.4 billion and $3.9 billion of allowance for credit losses related to purchased credit-impaired loans at December 31, 2010 and 2009.
Bank of America 2010 103