Bank of America 2010 Annual Report Download - page 136
Download and view the complete annual report
Please find page 136 of the 2010 Bank of America annual report below. You can navigate through the pages in the report by either clicking on the pages listed below, or by using the keyword search tool below to find specific information within the annual report.-
 1
1 -
2
-
3
-
4
-
5
-
6
-
7
-
8
-
9
-
10
-
11
-
12
-
13
-
14
-
15
-
16
-
17
-
18
-
19
-
20
-
21
-
22
-
23
-
24
-
25
-
26
-
27
-
28
-
29
-
30
-
31
-
32
-
33
-
34
-
35
-
36
-
37
-
38
-
39
-
40
-
41
-
42
-
43
-
44
-
45
-
46
-
47
-
48
-
49
-
50
-
51
-
52
-
53
-
54
-
55
-
56
-
57
-
58
-
59
-
60
-
61
-
62
-
63
-
64
-
65
-
66
-
67
-
68
-
69
-
70
-
71
-
72
-
73
-
74
-
75
-
76
-
77
-
78
-
79
-
80
-
81
-
82
-
83
-
84
-
85
-
86
-
87
-
88
-
89
-
90
-
91
-
92
-
93
-
94
-
95
-
96
-
97
-
98
-
99
-
100
-
101
-
102
-
103
-
104
-
105
-
106
-
107
-
108
-
109
-
110
-
111
-
112
-
113
-
114
-
115
-
116
-
117
-
118
-
119
-
120
-
121
-
122
-
123
-
124
-
125
-
 126
126 -
 127
127 -
 128
128 -
 129
129 -
 130
130 -
 131
131 -
 132
132 -
 133
133 -
 134
134 -
 135
135 -
 136
136 -
 137
137 -
 138
138 -
 139
139 -
 140
140 -
 141
141 -
 142
142 -
 143
143 -
 144
144 -
 145
145 -
 146
146 -
147
-
148
-
149
-
150
-
151
-
152
-
153
-
154
-
155
-
156
-
157
-
158
-
159
-
160
-
161
-
162
-
163
-
164
-
165
-
166
-
167
-
168
-
169
-
170
-
171
-
172
-
173
-
174
-
175
-
176
-
177
-
178
-
179
-
180
-
181
-
182
-
183
-
184
-
185
-
186
-
187
-
188
-
189
-
190
-
191
-
192
-
193
-
194
-
195
-
196
-
197
-
198
-
199
-
200
-
201
-
202
-
203
-
204
-
205
-
206
-
207
-
208
-
209
-
210
-
211
-
212
-
213
-
214
-
215
-
216
-
217
-
218
-
219
-
220
-
221
-
222
-
223
-
224
-
225
-
226
-
227
-
228
-
229
-
230
-
231
-
232
-
233
-
234
-
235
-
236
-
237
-
238
-
239
-
240
-
241
-
242
-
243
-
244
-
245
-
246
-
247
-
248
-
249
-
250
-
251
-
252
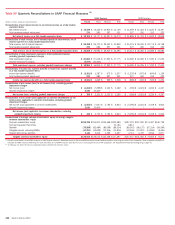
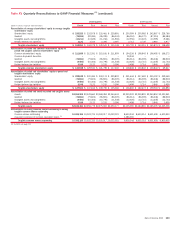
 |
 |

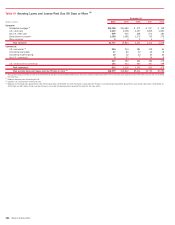
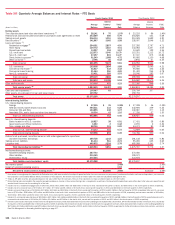
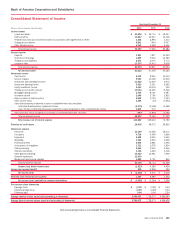
Table XVI Quarterly Average Balances and Interest Rates – FTE Basis
(Dollars in millions)
Average
Balance
Interest
Income/
Expense
Yield/
Rate
Average
Balance
Interest
Income/
Expense
Yield/
Rate
Fourth Quarter 2010 Third Quarter 2010
Earning assets
Time deposits placed and other short-term investments
(1)
$ 28,141 $ 75 1.07%
$ 23,233 $ 86 1.45%
Federal funds sold and securities borrowed or purchased under agreements to resell
243,589 486 0.79
254,820 441 0.69
Trading account assets
216,003 1,710 3.15
210,529 1,692 3.20
Debt securities
(2)
341,867 3,065 3.58
328,097 2,646 3.22
Loans and leases
(3)
:
Residential mortgage
(4)
254,051 2,857 4.50
237,292 2,797 4.71
Home equity
139,772 1,410 4.01
143,083 1,457 4.05
Discontinued real estate
13,297 118 3.57
13,632 122 3.56
U.S. credit card
112,673 3,040 10.70
115,251 3,113 10.72
Non-U.S. credit card
27,457 815 11.77
27,047 875 12.84
Direct/Indirect consumer
(5)
91,549 1,088 4.72
95,692 1,130 4.68
Other consumer
(6)
2,796 45 6.32
2,955 47 6.35
Total consumer
641,595 9,373 5.81
634,952 9,541 5.98
U.S. commercial
193,608 1,894 3.88
192,306 2,040 4.21
Commercial real estate
(7)
51,617 432 3.32
55,660 452 3.22
Commercial lease financing
21,363 250 4.69
21,402 255 4.78
Non-U.S. commercial
32,431 289 3.53
30,540 282 3.67
Total commercial
299,019 2,865 3.81
299,908 3,029 4.01
Total loans and leases
940,614 12,238 5.18
934,860 12,570 5.35
Other earning assets
113,325 923 3.23
112,280 949 3.36
Total earning assets
(8)
1,883,539 18,497 3.90
1,863,819 18,384 3.93
Cash and cash equivalents
(1)
136,967 63
155,784 107
Other assets, less allowance for loan and lease losses
349,752
359,794
Total assets
$2,370,258
$2,379,397
Interest-bearing liabilities
U.S. interest-bearing deposits:
Savings
$ 37,145 $ 35 0.36%
$ 37,008 $ 36 0.39%
NOW and money market deposit accounts
464,531 333 0.28
442,906 359 0.32
Consumer CDs and IRAs
124,855 338 1.07
132,687 377 1.13
Negotiable CDs, public funds and other time deposits
16,334 47 1.16
17,326 57 1.30
Total U.S. interest-bearing deposits
642,865 753 0.46
629,927 829 0.52
Non-U.S. interest-bearing deposits:
Banks located in non-U.S. countries
16,827 38 0.91
17,431 38 0.86
Governments and official institutions
1,560 2 0.42
2,055 2 0.36
Time, savings and other
58,746 101 0.69
54,373 81 0.59
Total non-U.S. interest-bearing deposits
77,133 141 0.73
73,859 121 0.65
Total interest-bearing deposits
719,998 894 0.49
703,786 950 0.54
Federal funds purchased, securities loaned or sold under agreements to repurchase
and other short-term borrowings
369,738 1,142 1.23
391,148 848 0.86
Trading account liabilities
81,313 561 2.74
95,265 635 2.65
Long-term debt
465,875 3,254 2.78
485,588 3,341 2.74
Total interest-bearing liabilities
(8)
1,636,924 5,851 1.42
1,675,787 5,774 1.37
Noninterest-bearing sources:
Noninterest-bearing deposits
287,740
270,060
Other liabilities
210,069
199,572
Shareholders’ equity
235,525
233,978
Total liabilities and shareholders’ equity
$2,370,258
$2,379,397
Net interest spread
2.48%
2.56%
Impact of noninterest-bearing sources
0.18
0.13
Net interest income/yield on earning assets
(1)
$12,646 2.66%
$12,610 2.69%
(1)
Fees earned on overnight deposits placed with the Federal Reserve, which were included in time deposits placed and other short-term investments in prior periods, have been reclassified to cash and cash equivalents, consistent with
the Corporation’s Consolidated Balance Sheet presentation of these deposits. Net interest income and net interest yield in the table are calculated excluding these fees.
(2)
Yields on AFS debt securities are calculated based on fair value rather than the cost basis. The use of fair value does not have a material impact on net interest yield.
(3)
Nonperforming loans are included in the respective average loan balances. Income on these nonperforming loans is recognized on a cash basis. Purchased credit-impaired loans were written down to fair value upon acquisition and
accrete interest income over the remaining life of the loan.
(4)
Includes non-U.S. residential mortgage loans of $96 million, $502 million, $506 million and $538 million in the fourth, third, second and first quarters of 2010, and $550 million in the fourth quarter of 2009, respectively.
(5)
Includes non-U.S. consumer loans of $7.9 billion, $7.7 billion, $7.7 billion and $8.1 billion in the fourth, third, second and first quarters of 2010, and $8.6 billion in the fourth quarter of 2009, respectively.
(6)
Includes consumer finance loans of $2.0 billion, $2.0 billion, $2.1 billion and $2.2 billion in the fourth, third, second and first quarters of 2010, and $2.3 billion in the fourth quarter of 2009, respectively; other non-U.S. consumer
loans of $791 million, $788 million, $679 million and $664 million in the fourth, third, second and first quarters of 2010, and $689 million in the fourth quarter of 2009, respectively; and consumer overdrafts of $34 million,
$123 million, $155 million and $132 million in the fourth, third, second and first quarters of 2010, and $192 million in the fourth quarter of 2009, respectively.
(7)
Includes U.S. commercialrealestate loans of $49.0 billion, $53.1 billion, $61.6 billion and $65.6 billion in the fourth, third, second and first quarters of 2010,and $68.2 billion inthe fourth quarter of 2009, respectively; and non-U.S.
commercial real estate loans of $2.6 billion, $2.5 billion, $2.6 billion and $3.0 billion in the fourth, third, second and first quarters of 2010, and $3.1 billion in the fourth quarter of 2009, respectively.
(8)
Interest income includes the impact of interest rate risk management contracts, which decreased interest income on the underlying assets by $29 million, $639 million, $479 million and $272 million in the fourth, third, second and
first quarters of 2010 and $248 million in the fourth quarter of 2009, respectively. Interest expense includes the impact of interest rate risk management contracts, which decreased interest expense on the underlying liabilities by
$672 million, $1.0 billion, $829 million and $970 million in the fourth, third, second and first quarters of 2010, and $1.1 billion in the fourth quarter of 2009, respectively. For further information on interest rate contracts, see Interest
Rate Risk Management for Nontrading Activities beginning on page 107.
134 Bank of America 2010