Bank of America 2010 Annual Report Download - page 130
Download and view the complete annual report
Please find page 130 of the 2010 Bank of America annual report below. You can navigate through the pages in the report by either clicking on the pages listed below, or by using the keyword search tool below to find specific information within the annual report.-
 1
1 -
2
-
3
-
4
-
5
-
6
-
7
-
8
-
9
-
10
-
11
-
12
-
13
-
14
-
15
-
16
-
17
-
18
-
19
-
20
-
21
-
22
-
23
-
24
-
25
-
26
-
27
-
28
-
29
-
30
-
31
-
32
-
33
-
34
-
35
-
36
-
37
-
38
-
39
-
40
-
41
-
42
-
43
-
44
-
45
-
46
-
47
-
48
-
49
-
50
-
51
-
52
-
53
-
54
-
55
-
56
-
57
-
58
-
59
-
60
-
61
-
62
-
63
-
64
-
65
-
66
-
67
-
68
-
69
-
70
-
71
-
72
-
73
-
74
-
75
-
76
-
77
-
78
-
79
-
80
-
81
-
82
-
83
-
84
-
85
-
86
-
87
-
88
-
89
-
90
-
91
-
92
-
93
-
94
-
95
-
96
-
97
-
98
-
99
-
100
-
101
-
102
-
103
-
104
-
105
-
106
-
107
-
108
-
109
-
110
-
111
-
112
-
113
-
114
-
115
-
116
-
117
-
118
-
119
-
 120
120 -
 121
121 -
 122
122 -
 123
123 -
 124
124 -
 125
125 -
 126
126 -
 127
127 -
 128
128 -
 129
129 -
 130
130 -
 131
131 -
 132
132 -
 133
133 -
 134
134 -
 135
135 -
 136
136 -
 137
137 -
 138
138 -
 139
139 -
 140
140 -
141
-
142
-
143
-
144
-
145
-
146
-
147
-
148
-
149
-
150
-
151
-
152
-
153
-
154
-
155
-
156
-
157
-
158
-
159
-
160
-
161
-
162
-
163
-
164
-
165
-
166
-
167
-
168
-
169
-
170
-
171
-
172
-
173
-
174
-
175
-
176
-
177
-
178
-
179
-
180
-
181
-
182
-
183
-
184
-
185
-
186
-
187
-
188
-
189
-
190
-
191
-
192
-
193
-
194
-
195
-
196
-
197
-
198
-
199
-
200
-
201
-
202
-
203
-
204
-
205
-
206
-
207
-
208
-
209
-
210
-
211
-
212
-
213
-
214
-
215
-
216
-
217
-
218
-
219
-
220
-
221
-
222
-
223
-
224
-
225
-
226
-
227
-
228
-
229
-
230
-
231
-
232
-
233
-
234
-
235
-
236
-
237
-
238
-
239
-
240
-
241
-
242
-
243
-
244
-
245
-
246
-
247
-
248
-
249
-
250
-
251
-
252
 |
 |

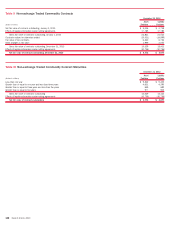
Table X Non-exchange Traded Commodity Contracts
(Dollars in millions)
Asset
Positions
Liability
Positions
December 31, 2010
Net fair value of contracts outstanding, January 1, 2010 $ 5,036 $ 3,758
Effects of legally enforceable master netting agreements 17,785 17,785
Gross fair value of contracts outstanding, January 1, 2010 22,821 21,543
Contracts realized or otherwise settled (15,531) (14,899)
Fair value of new contracts 6,240 6,734
Other changes in fair value 1,999 2,055
Gross fair value of contracts outstanding, December 31, 2010 15,529 15,433
Effects of legally enforceable master netting agreements (10,756) (10,756)
Net fair value of contracts outstanding, December 31, 2010 $4,773 $4,677
Table XI Non-exchange Traded Commodity Contract Maturities
(Dollars in millions)
Asset
Positions
Liability
Positions
December 31, 2010
Less than one year $ 9,262 $ 9,453
Greater than or equal to one year and less than three years 4,631 4,395
Greater than or equal to three years and less than five years 659 682
Greater than or equal to five years 977 903
Gross fair value of contracts outstanding 15,529 15,433
Effects of legally enforceable master netting agreements (10,756) (10,756)
Net fair value of contracts outstanding $4,773 $4,677
128 Bank of America 2010