Bank of America 2010 Annual Report Download - page 35
Download and view the complete annual report
Please find page 35 of the 2010 Bank of America annual report below. You can navigate through the pages in the report by either clicking on the pages listed below, or by using the keyword search tool below to find specific information within the annual report.-
 1
1 -
2
-
3
-
4
-
5
-
6
-
7
-
8
-
9
-
10
-
11
-
12
-
13
-
14
-
15
-
16
-
17
-
18
-
19
-
20
-
21
-
22
-
23
-
24
-
 25
25 -
 26
26 -
 27
27 -
 28
28 -
 29
29 -
 30
30 -
 31
31 -
 32
32 -
 33
33 -
 34
34 -
 35
35 -
 36
36 -
 37
37 -
 38
38 -
 39
39 -
 40
40 -
 41
41 -
 42
42 -
 43
43 -
 44
44 -
 45
45 -
46
-
47
-
48
-
49
-
50
-
51
-
52
-
53
-
54
-
55
-
56
-
57
-
58
-
59
-
60
-
61
-
62
-
63
-
64
-
65
-
66
-
67
-
68
-
69
-
70
-
71
-
72
-
73
-
74
-
75
-
76
-
77
-
78
-
79
-
80
-
81
-
82
-
83
-
84
-
85
-
86
-
87
-
88
-
89
-
90
-
91
-
92
-
93
-
94
-
95
-
96
-
97
-
98
-
99
-
100
-
101
-
102
-
103
-
104
-
105
-
106
-
107
-
108
-
109
-
110
-
111
-
112
-
113
-
114
-
115
-
116
-
117
-
118
-
119
-
120
-
121
-
122
-
123
-
124
-
125
-
126
-
127
-
128
-
129
-
130
-
131
-
132
-
133
-
134
-
135
-
136
-
137
-
138
-
139
-
140
-
141
-
142
-
143
-
144
-
145
-
146
-
147
-
148
-
149
-
150
-
151
-
152
-
153
-
154
-
155
-
156
-
157
-
158
-
159
-
160
-
161
-
162
-
163
-
164
-
165
-
166
-
167
-
168
-
169
-
170
-
171
-
172
-
173
-
174
-
175
-
176
-
177
-
178
-
179
-
180
-
181
-
182
-
183
-
184
-
185
-
186
-
187
-
188
-
189
-
190
-
191
-
192
-
193
-
194
-
195
-
196
-
197
-
198
-
199
-
200
-
201
-
202
-
203
-
204
-
205
-
206
-
207
-
208
-
209
-
210
-
211
-
212
-
213
-
214
-
215
-
216
-
217
-
218
-
219
-
220
-
221
-
222
-
223
-
224
-
225
-
226
-
227
-
228
-
229
-
230
-
231
-
232
-
233
-
234
-
235
-
236
-
237
-
238
-
239
-
240
-
241
-
242
-
243
-
244
-
245
-
246
-
247
-
248
-
249
-
250
-
251
-
252
 |
 |

$392 million charge from a U.K. law change referred to below and a $1.7 bil-
lion tax benefit from the release of a portion of the deferred tax asset
valuation allowance related to acquired capital loss carryforward tax benefits
compared to $650 million in 2009. For more information, see Note 21
— Income Taxes to the Consolidated Financial Statements.
During 2010, the U.K. government enacted a tax law change reducing the
corporate income tax rate by one percent effective for the 2011 U.K. tax
financial year beginning on April 1, 2011. This reduction favorably affects
income tax expense on future U.K. earnings, but also required us to re-
measure our U.K. net deferred tax assets using the lower tax rate. The U.K.
corporate tax rate reduction resulted in an income tax charge of $392 million
in 2010. If future rate reductions were to be enacted as suggested in U.K.
Treasury announcements and assuming no change in the deferred tax asset
balance, a similar charge to income tax expense for each one percent
reduction in the rate would result during each period of enactment. For more
information, see Regulatory Matters beginning on page 60.
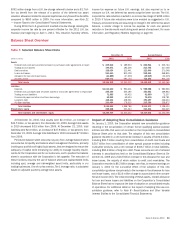
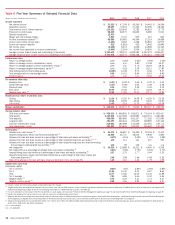
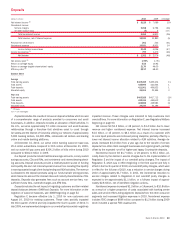
Balance Sheet Overview
Table 5 Selected Balance Sheet Data
(Dollars in millions)
2010 2009 2010 2009
December 31 Average Balance
Assets
Federal funds sold and securities borrowed or purchased under agreements to resell
$ 209,616
$ 189,933
$ 256,943
$235,764
Trading account assets
194,671
182,206
213,745
217,048
Debt securities
338,054
311,441
323,946
271,048
Loans and leases
940,440
900,128
958,331
948,805
Allowance for loan and lease losses
(41,885)
(37,200)
(45,619)
(33,315)
All other assets
624,013
683,724
732,256
803,718
Total assets
$2,264,909
$2,230,232
$2,439,602
$2,443,068
Liabilities
Deposits
$1,010,430
$ 991,611
$ 988,586
$980,966
Federal funds purchased and securities loaned or sold under agreements to repurchase
245,359
255,185
353,653
369,863
Trading account liabilities
71,985
65,432
91,669
72,207
Commercial paper and other short-term borrowings
59,962
69,524
76,676
118,781
Long-term debt
448,431
438,521
490,497
446,634
All other liabilities
200,494
178,515
205,290
209,972
Total liabilities
2,036,661
1,998,788
2,206,371
2,198,423
Shareholders’ equity
228,248
231,444
233,231
244,645
Total liabilities and shareholders’ equity
$2,264,909
$2,230,232
$2,439,602
$2,443,068
At December 31, 2010, total assets were $2.3 trillion, an increase of
$34.7 billion, or two percent, from December 31, 2009. Average total assets
in 2010 decreased $3.5 billion from 2009. At December 31, 2010, total
liabilities were $2.0 trillion, an increase of $37.9 billion, or two percent, from
December 31, 2009. Average total liabilities for 2010 increased $7.9 billion
from 2009.
Period-end balance sheet amounts may vary from average balance sheet
amounts due to liquidity and balance sheet management functions, primarily
involving our portfolios of highly liquid assets, that are designed to ensure the
adequacy of capital while enhancing our ability to manage liquidity require-
ments for the Corporation and for our customers, and to position the balance
sheet in accordance with the Corporation’s risk appetite. The execution of
these functions requires the use of balance sheet and capital-related limits
including spot, average and risk-weighted asset limits, particularly in our
trading businesses. One of our key metrics, Tier 1 leverage ratio, is calculated
based on adjusted quarterly average total assets.
Impact of Adopting New Consolidation Guidance
On January 1, 2010, the Corporation adopted new consolidation guidance
resulting in the consolidation of certain former qualifying special purpose
entities and VIEs that were not recorded on the Corporation’s Consolidated
Balance Sheet prior to that date. The adoption of this new consolidation
guidance resulted in a net incremental increase in assets of $100.4 billion,
including $69.7 billion resulting from consolidation of credit card trusts and
$30.7 billion from consolidation of other special purpose entities including
multi-seller conduits, and a net increase of $106.7 billion in total liabilities,
including $84.4 billion of long-term debt. These amounts are net of retained
interests in securitizations held on the Consolidated Balance Sheet at De-
cember 31, 2009 and a $10.8 billion increase in the allowance for loan and
lease losses, the majority of which relates to credit card receivables. The
Corporation recorded a $6.2 billion charge, net-of-tax, to retained earnings on
January 1, 2010 for the cumulative effect of the adoption of this new
consolidation guidance due primarily to the increase in the allowance for loan
and lease losses, and a $116 million charge to accumulated other compre-
hensive income (OCI). The initial recording of these assets, related allowance
for loan and lease losses and liabilities on the Corporation’s Consolidated
Balance Sheet had no impact at the date of adoption on consolidated results
of operations. For additional detail on the impact of adopting this new con-
solidation guidance, refer to Note 8 – Securitizations and Other Variable
Interest Entities to the Consolidated Financial Statements.
Bank of America 2010 33