Bank of America 2010 Annual Report Download - page 57
Download and view the complete annual report
Please find page 57 of the 2010 Bank of America annual report below. You can navigate through the pages in the report by either clicking on the pages listed below, or by using the keyword search tool below to find specific information within the annual report.-
 1
1 -
2
-
3
-
4
-
5
-
6
-
7
-
8
-
9
-
10
-
11
-
12
-
13
-
14
-
15
-
16
-
17
-
18
-
19
-
20
-
21
-
22
-
23
-
24
-
25
-
26
-
27
-
28
-
29
-
30
-
31
-
32
-
33
-
34
-
35
-
36
-
37
-
38
-
39
-
40
-
41
-
42
-
43
-
44
-
45
-
46
-
 47
47 -
 48
48 -
 49
49 -
 50
50 -
 51
51 -
 52
52 -
 53
53 -
 54
54 -
 55
55 -
 56
56 -
 57
57 -
 58
58 -
 59
59 -
 60
60 -
 61
61 -
 62
62 -
 63
63 -
 64
64 -
 65
65 -
 66
66 -
 67
67 -
68
-
69
-
70
-
71
-
72
-
73
-
74
-
75
-
76
-
77
-
78
-
79
-
80
-
81
-
82
-
83
-
84
-
85
-
86
-
87
-
88
-
89
-
90
-
91
-
92
-
93
-
94
-
95
-
96
-
97
-
98
-
99
-
100
-
101
-
102
-
103
-
104
-
105
-
106
-
107
-
108
-
109
-
110
-
111
-
112
-
113
-
114
-
115
-
116
-
117
-
118
-
119
-
120
-
121
-
122
-
123
-
124
-
125
-
126
-
127
-
128
-
129
-
130
-
131
-
132
-
133
-
134
-
135
-
136
-
137
-
138
-
139
-
140
-
141
-
142
-
143
-
144
-
145
-
146
-
147
-
148
-
149
-
150
-
151
-
152
-
153
-
154
-
155
-
156
-
157
-
158
-
159
-
160
-
161
-
162
-
163
-
164
-
165
-
166
-
167
-
168
-
169
-
170
-
171
-
172
-
173
-
174
-
175
-
176
-
177
-
178
-
179
-
180
-
181
-
182
-
183
-
184
-
185
-
186
-
187
-
188
-
189
-
190
-
191
-
192
-
193
-
194
-
195
-
196
-
197
-
198
-
199
-
200
-
201
-
202
-
203
-
204
-
205
-
206
-
207
-
208
-
209
-
210
-
211
-
212
-
213
-
214
-
215
-
216
-
217
-
218
-
219
-
220
-
221
-
222
-
223
-
224
-
225
-
226
-
227
-
228
-
229
-
230
-
231
-
232
-
233
-
234
-
235
-
236
-
237
-
238
-
239
-
240
-
241
-
242
-
243
-
244
-
245
-
246
-
247
-
248
-
249
-
250
-
251
-
252
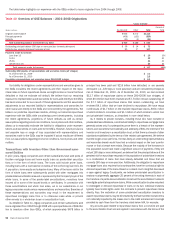
 |
 |

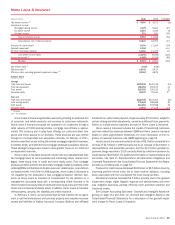
In 2010, the $2.7 billion Corporate Investments equity securities portfo-
lio, which consisted of highly liquid publicly-traded equity securities, was sold
as a result of a change in our investment portfolio objectives shifting more to
interest earnings and reducing our exposure to equity market risk, which
contributed to the $293 million loss in 2010.
Global Principal Investments (GPI) is comprised of a diversified portfolio of
investments in private equity, real estate and other alternative investments.
These investments are made either directly in a company or held through a
fund with related income recorded in equity investment income. GPI had
unfunded equity commitments of $1.4 billion and $2.5 billion at December 31,
2010 and 2009, related to certain of these investments. During 2010, we
sold our exposure of $2.9 billion in certain private equity funds, comprised of
$1.5 billion in funded exposure and $1.4 billion in unfunded commitments in
these funds as we continue to reduce our equity exposure.
Affiliates of the Corporation may, from time to time, act as general partner,
fund manager and/or investment advisor to certain Corporation-sponsored
real estate private equity funds. In this capacity, these affiliates manage
and/or provide investment advisory services to such real estate private equity
funds primarily for the benefit of third-party institutional and private clients.
These activities, which are recorded in GPI, inherently involve risk to us and to
the fund investors, and in certain situations may result in losses. In 2010, we
recorded a loss of $163 million related to a consolidated real estate private
equity fund for which we were the general partner and investment advisor. In
late 2010, the general partner and investment advisor responsibilities were
transferred to an independent third-party asset manager.
Strategic Investments includes primarily our investment in CCB of
$19.7 billion as well as our $2.6 billion remaining investment in BlackRock.
At December 31, 2010, we owned approximately 10 percent, or 25.6 billion
common shares of CCB. During 2010, we sold certain rights related to our
investment in CCB resulting in a gain of $432 million. Also during 2010, we
sold our Itaú Unibanco and Santander equity investments resulting in a net
gain of approximately $800 million and a portion of our interest in BlackRock
resulting in a gain of $91 million.
All Other reported net income of $1.1 billion in 2010 compared to
$1.3 billion in 2009 with the decline due to decreases in net interest income
and noninterest income compared to the prior year. The decrease in net
interest income was driven by a $1.4 billion lower funding differential on
certain securitizations and the impact of capital raises occurring throughout
2009 that were not allocated to the businesses. Noninterest income de-
creased $4.9 billion, as the prior year included a $7.3 billion gain resulting
from sales of shares of CCB and an increase of $1.4 billion on net gains on the
sale of debt securities. This was offset by net negative fair value adjustments
of $4.9 billion on structured liabilities in 2009 compared to a net positive
adjustment of $18 million in 2010 and higher valuation adjustments and
gains on sales of select investments in GPI. Also in 2010, we sold our
investments in Itaú Unibanco and Santander resulting in a net gain of
approximately $800 million, as well as the gains on CCB and BlackRock.
For more information on the sales of these investments, see Note 5 – Secu-
rities to the Consolidated Financial Statements.
Provision for credit losses decreased $3.4 billion to $4.6 billion due to
improving portfolio trends in the residential mortgage portfolio partially offset
by further deterioration in the Countrywide purchased credit-impaired discon-
tinued real estate portfolio.
The income tax benefit in 2010 was $4.1 billion compared to $2.4 billion
in 2009, driven by an increase in the pre-tax loss as well as the release of a
higher portion of a deferred tax asset valuation allowance.
During 2010, we completed the sale of First Republic at book value and as
a result, we removed $17.4 billion of loans and $17.8 billion of deposits from
the Corporation’s Consolidated Balance Sheet.
Off-Balance Sheet Arrangements and Contractual
Obligations
We have contractual obligations to make future payments on debt and lease
agreements. Additionally, in the normal course of business, we enter into
contractual arrangements whereby we commit to future purchases of prod-
ucts or services from unaffiliated parties. Obligations that are legally binding
agreements whereby we agree to purchase products or services with a
specific minimum quantity defined at a fixed, minimum or variable price over
a specified period of time are defined as purchase obligations. Included in
purchase obligations are commitments to purchase loans of $2.6 billion and
vendor contracts of $7.1 billion. The most significant vendor contracts include
communication services, processing services and software contracts. Other
long-term liabilities include our contractual funding obligations related to the
Qualified Pension Plans, Non-U.S. Pension Plans, Nonqualified Pension Plans,
and Postretirement Health and Life Plans (the Plans). Obligations to the Plans
are based on the current and projected obligations of the Plans, performance
of the Plans’ assets and any participant contributions, if applicable. During
2010 and 2009, we contributed $378 million and $414 million to the Plans,
and we expect to make at least $306 million of contributions during 2011.
Debt, lease, equity and other obligations are more fully discussed in
Note 13 – Long-term Debt and Note 14 – Commitments and Contingencies to
the Consolidated Financial Statements. The Plans are more fully discussed in
Note 19 – Employee Benefit Plans to the Consolidated Financial Statements.
We enter into commitments to extend credit such as loan commitments,
standby letters of credit (SBLCs) and commercial letters of credit to meet the
financing needs of our customers. For a summary of the total unfunded, or off-
balance sheet, credit extension commitment amounts by expiration date, see
the table in Note 14 – Commitments and Contingencies to the Consolidated
Financial Statements.
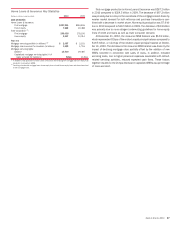
Table 9 presents total long-term debt and other obligations at December 31,
2010.
Table 9 Long-term Debt and Other Obligations
(Dollars in millions)
Due in
1 Year or Less
Due after
1 Year through
3 Years
Due after
3 Years through
5 Years
Due after
5 Years Total
December 31, 2010
Long-term debt and capital leases $ 89,251 $138,603 $69,539 $151,038
$448,431
Operating lease obligations 3,016 4,716 2,894 6,624
17,250
Purchase obligations 5,257 2,490 1,603 1,077
10,427
Time deposits 181,280 17,548 4,752 4,178
207,758
Other long-term liabilities 696 1,047 770 1,150
3,663
Total long-term debt and other obligations $279,500 $164,404 $79,558 $164,067 $687,529
Bank of America 2010 55