Bank of America 2010 Annual Report Download - page 42
Download and view the complete annual report
Please find page 42 of the 2010 Bank of America annual report below. You can navigate through the pages in the report by either clicking on the pages listed below, or by using the keyword search tool below to find specific information within the annual report.-
 1
1 -
2
-
3
-
4
-
5
-
6
-
7
-
8
-
9
-
10
-
11
-
12
-
13
-
14
-
15
-
16
-
17
-
18
-
19
-
20
-
21
-
22
-
23
-
24
-
25
-
26
-
27
-
28
-
29
-
30
-
31
-
 32
32 -
 33
33 -
 34
34 -
 35
35 -
 36
36 -
 37
37 -
 38
38 -
 39
39 -
 40
40 -
 41
41 -
 42
42 -
 43
43 -
 44
44 -
 45
45 -
 46
46 -
 47
47 -
 48
48 -
 49
49 -
 50
50 -
 51
51 -
 52
52 -
53
-
54
-
55
-
56
-
57
-
58
-
59
-
60
-
61
-
62
-
63
-
64
-
65
-
66
-
67
-
68
-
69
-
70
-
71
-
72
-
73
-
74
-
75
-
76
-
77
-
78
-
79
-
80
-
81
-
82
-
83
-
84
-
85
-
86
-
87
-
88
-
89
-
90
-
91
-
92
-
93
-
94
-
95
-
96
-
97
-
98
-
99
-
100
-
101
-
102
-
103
-
104
-
105
-
106
-
107
-
108
-
109
-
110
-
111
-
112
-
113
-
114
-
115
-
116
-
117
-
118
-
119
-
120
-
121
-
122
-
123
-
124
-
125
-
126
-
127
-
128
-
129
-
130
-
131
-
132
-
133
-
134
-
135
-
136
-
137
-
138
-
139
-
140
-
141
-
142
-
143
-
144
-
145
-
146
-
147
-
148
-
149
-
150
-
151
-
152
-
153
-
154
-
155
-
156
-
157
-
158
-
159
-
160
-
161
-
162
-
163
-
164
-
165
-
166
-
167
-
168
-
169
-
170
-
171
-
172
-
173
-
174
-
175
-
176
-
177
-
178
-
179
-
180
-
181
-
182
-
183
-
184
-
185
-
186
-
187
-
188
-
189
-
190
-
191
-
192
-
193
-
194
-
195
-
196
-
197
-
198
-
199
-
200
-
201
-
202
-
203
-
204
-
205
-
206
-
207
-
208
-
209
-
210
-
211
-
212
-
213
-
214
-
215
-
216
-
217
-
218
-
219
-
220
-
221
-
222
-
223
-
224
-
225
-
226
-
227
-
228
-
229
-
230
-
231
-
232
-
233
-
234
-
235
-
236
-
237
-
238
-
239
-
240
-
241
-
242
-
243
-
244
-
245
-
246
-
247
-
248
-
249
-
250
-
251
-
252
 |
 |

Supplemental Financial Data
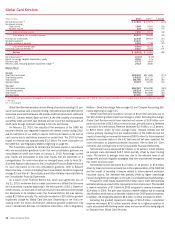
We view net interest income and related ratios and analyses (i.e., efficiency
ratio and net interest yield) on a FTE basis. Although these are non-GAAP
measures, we believe managing the business with net interest income on a
FTE basis provides a more accurate picture of the interest margin for com-
parative purposes. To derive the FTE basis, net interest income is adjusted to
reflect tax-exempt income on an equivalent before-tax basis with a corre-
sponding increase in income tax expense. For purposes of this calculation, we
use the federal statutory tax rate of 35 percent. This measure ensures
comparability of net interest income arising from taxable and tax-exempt
sources.
As mentioned above, certain performance measures including the effi-
ciency ratio and net interest yield utilize net interest income (and thus total
revenue) on a FTE basis. The efficiency ratio measures the costs expended to
generate a dollar of revenue, and net interest yield evaluates how many basis
points we are earning over the cost of funds. During our annual planning
process, we set efficiency targets for the Corporation and each line of
business. We believe the use of these non-GAAP measures provides addi-
tional clarity in assessing our results. Targets vary by year and by business
and are based on a variety of factors including maturity of the business,
competitive environment, market factors and other items including our risk
appetite.
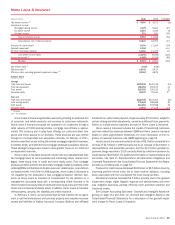
We also evaluate our business based on the following ratios that utilize
tangible equity, a non-GAAP measure. Return on average tangible common
shareholders’ equity measures our earnings contribution as a percentage of
common shareholders’ equity plus any Common Equivalent Securities (CES)
less goodwill and intangible assets, (excluding MSRs), net of related deferred
tax liabilities. ROTE measures our earnings contribution as a percentage of
average shareholders’ equity less goodwill and intangible assets (excluding
MSRs), net of related deferred tax liabilities. The tangible common equity ratio
represents common shareholders’ equity plus any CES less goodwill and
intangible assets (excluding MSRs), net of related deferred tax liabilities
divided by total assets less goodwill and intangible assets (excluding MSRs),
net of related deferred tax liabilities. The tangible equity ratio represents total
shareholders’ equity less goodwill and intangible assets (excluding MSRs),
net of related deferred tax liabilities divided by total assets less goodwill and
intangible assets (excluding MSRs), net of related deferred tax liabilities.
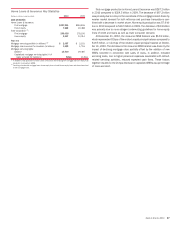
Tangible book value per common share represents ending common share-
holders’ equity less goodwill and intangible assets (excluding MSRs), net of
related deferred tax liabilities divided by ending common shares outstanding
plus the number of common shares issued upon conversion of common
equivalent shares. These measures are used to evaluate our use of equity
(i.e., capital). In addition, profitability, relationship and investment models all
use ROTE as key measures to support our overall growth goals.
The aforementioned supplemental data and performance measures are
presented in Tables 6 and 7 and Statistical Tables XII and XIV. In addition, in
Table 7 and Statistical Table XIV, we have excluded the impact of goodwill
impairment charges of $12.4 billion recorded in 2010 when presenting
earnings and diluted earnings per common share, the efficiency ratio, return
on average assets, return on average common shareholders’ equity, return on
average tangible common shareholders’ equity and ROTE. Accordingly, these
are non-GAAP measures. Statistical Tables XIII and XV provide reconciliations
of these non-GAAP measures with financial measures defined by GAAP. We
believe the use of these non-GAAP measures provides additional clarity in
assessing the results of the Corporation. Other companies may define or
calculate these measures and ratios differently.
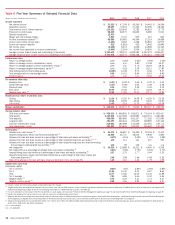
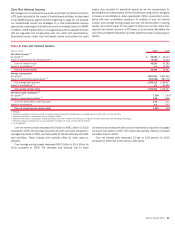
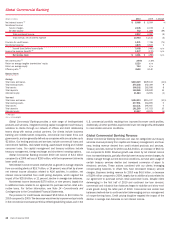
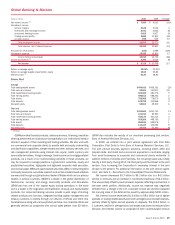
Table 7 Five Year Supplemental Financial Data
(Dollars in millions, except per share information)
2010 2009 2008 2007 2006
Fully taxable-equivalent basis data
Net interest income
$52,693
$ 48,410 $46,554 $36,190 $35,818
Total revenue, net of interest expense
111,390
120,944 73,976 68,582 74,000
Net interest yield
(1)
2.78%
2.65% 2.98% 2.60% 2.82%
Efficiency ratio
74.61
55.16 56.14 54.71 48.37
Performance ratios, excluding goodwill impairment charges
(2)
Per common share information
Earnings
$0.87
Diluted earnings
0.86
Efficiency ratio
63.48%
Return on average assets
0.42
Return on average common shareholders’ equity
4.14
Return on average tangible common shareholders’ equity
7.03
Return on average tangible shareholders’ equity
7.11
(1)
Calculation includes fees earned on overnight deposits placed with the Federal Reserve of $368 million and $379 million for 2010 and 2009. The Corporation did not have fees earned on overnight deposits during 2008, 2007 and
2006.
(2)
Performance ratios are calculated excluding the impact of goodwill impairment charges of $12.4 billion recorded during 2010.
40 Bank of America 2010