Bank of America 2010 Annual Report Download - page 159
Download and view the complete annual report
Please find page 159 of the 2010 Bank of America annual report below. You can navigate through the pages in the report by either clicking on the pages listed below, or by using the keyword search tool below to find specific information within the annual report.-
 1
1 -
2
-
3
-
4
-
5
-
6
-
7
-
8
-
9
-
10
-
11
-
12
-
13
-
14
-
15
-
16
-
17
-
18
-
19
-
20
-
21
-
22
-
23
-
24
-
25
-
26
-
27
-
28
-
29
-
30
-
31
-
32
-
33
-
34
-
35
-
36
-
37
-
38
-
39
-
40
-
41
-
42
-
43
-
44
-
45
-
46
-
47
-
48
-
49
-
50
-
51
-
52
-
53
-
54
-
55
-
56
-
57
-
58
-
59
-
60
-
61
-
62
-
63
-
64
-
65
-
66
-
67
-
68
-
69
-
70
-
71
-
72
-
73
-
74
-
75
-
76
-
77
-
78
-
79
-
80
-
81
-
82
-
83
-
84
-
85
-
86
-
87
-
88
-
89
-
90
-
91
-
92
-
93
-
94
-
95
-
96
-
97
-
98
-
99
-
100
-
101
-
102
-
103
-
104
-
105
-
106
-
107
-
108
-
109
-
110
-
111
-
112
-
113
-
114
-
115
-
116
-
117
-
118
-
119
-
120
-
121
-
122
-
123
-
124
-
125
-
126
-
127
-
128
-
129
-
130
-
131
-
132
-
133
-
134
-
135
-
136
-
137
-
138
-
139
-
140
-
141
-
142
-
143
-
144
-
145
-
146
-
147
-
148
-
 149
149 -
 150
150 -
 151
151 -
 152
152 -
 153
153 -
 154
154 -
 155
155 -
 156
156 -
 157
157 -
 158
158 -
 159
159 -
 160
160 -
 161
161 -
 162
162 -
 163
163 -
 164
164 -
 165
165 -
 166
166 -
 167
167 -
 168
168 -
 169
169 -
170
-
171
-
172
-
173
-
174
-
175
-
176
-
177
-
178
-
179
-
180
-
181
-
182
-
183
-
184
-
185
-
186
-
187
-
188
-
189
-
190
-
191
-
192
-
193
-
194
-
195
-
196
-
197
-
198
-
199
-
200
-
201
-
202
-
203
-
204
-
205
-
206
-
207
-
208
-
209
-
210
-
211
-
212
-
213
-
214
-
215
-
216
-
217
-
218
-
219
-
220
-
221
-
222
-
223
-
224
-
225
-
226
-
227
-
228
-
229
-
230
-
231
-
232
-
233
-
234
-
235
-
236
-
237
-
238
-
239
-
240
-
241
-
242
-
243
-
244
-
245
-
246
-
247
-
248
-
249
-
250
-
251
-
252
 |
 |

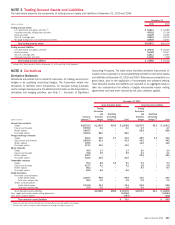
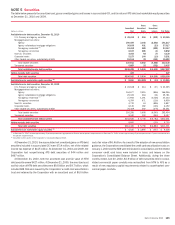
NOTE 3 Trading Account Assets and Liabilities
The table below presents the components of trading account assets and liabilities at December 31, 2010 and 2009.
(Dollars in millions)
2010 2009
December 31
Trading account assets
U.S. government and agency securities
(1)
$60,811
$ 44,585
Corporate securities, trading loans and other
49,352
57,009
Equity securities
32,129
33,562
Non-U.S. sovereign debt
33,523
28,143
Mortgage trading loans and asset-backed securities
18,856
18,907
Total trading account assets
$194,671
$182,206
Trading account liabilities
U.S. government and agency securities
$29,340
$ 26,519
Equity securities
15,482
18,407
Non-U.S. sovereign debt
15,813
12,897
Corporate securities and other
11,350
7,609
Total trading account liabilities
$71,985
$ 65,432
(1)
Includes $29.7 billion and $23.5 billion at December 31, 2010 and 2009 of GSE obligations.
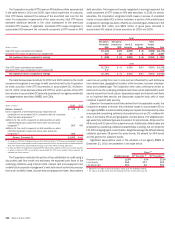
NOTE 4 Derivatives
Derivative Balances
Derivatives are entered into on behalf of customers, for trading, as economic
hedges or as qualifying accounting hedges. The Corporation enters into
derivatives to facilitate client transactions, for principal trading purposes
and to manage risk exposures. For additional information on the Corporation’s
derivatives and hedging activities, see Note 1 – Summary of Significant
Accounting Principles. The table below identifies derivative instruments in-
cluded on the Corporation’s Consolidated Balance Sheet in derivative assets
and liabilities at December 31, 2010 and 2009. Balances are presented on a
gross basis, prior to the application of counterparty and collateral netting.
Total derivative assets and liabilities are adjusted on an aggregate basis to
take into consideration the effects of legally enforceable master netting
agreements and have been reduced by the cash collateral applied.
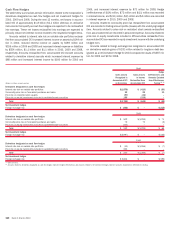
(Dollars in billions)
Contract/
Notional
(1)
Trading
Derivatives
and
Economic
Hedges
Qualifying
Accounting
Hedges
(2)
Total
Trading
Derivatives
and
Economic
Hedges
Qualifying
Accounting
Hedges
(2)
Total
Gross Derivative Assets Gross Derivative Liabilities
December 31, 2010
Interest rate contracts
Swaps
$42,719.2 $1,193.9 $14.9 $ 1,208.8 $1,187.9 $2.2 $ 1,190.1
Futures and forwards
9.939.2 6.0 – 6.0 4.7 – 4.7
Written options
2,887.7 – – – 82.8 – 82.8
Purchased options
3,026.2 88.0 – 88.0 – – –
Foreign exchange contracts
Swaps
630.1 26.5 3.7 30.2 28.5 2.1 30.6
Spot, futures and forwards
2,652.9 41.3 – 41.3 44.2 – 44.2
Written options
439.6 – – – 13.2 – 13.2
Purchased options
417.1 13.0 – 13.0 – – –
Equity contracts
Swaps
42.4 1.7 – 1.7 2.0 – 2.0
Futures and forwards
78.8 2.9 – 2.9 2.1 – 2.1
Written options
242.7 – – – 19.4 – 19.4
Purchased options
193.5 21.5 – 21.5 – – –
Commodity contracts
Swaps
90.2 8.8 0.2 9.0 9.3 – 9.3
Futures and forwards
413.7 4.1 – 4.1 2.8 – 2.8
Written options
86.3 – – – 6.7 – 6.7
Purchased options
84.6 6.6 – 6.6 – – –
Credit derivatives
Purchased credit derivatives:
Credit default swaps
2,184.7 69.8 – 69.8 34.0 – 34.0
Total return swaps/other
26.0 0.9 – 0.9 0.2 – 0.2
Written credit derivatives:
Credit default swaps
2,133.5 33.3 – 33.3 63.2 – 63.2
Total return swaps/other
22.5 0.5 – 0.5 0.5 – 0.5
Gross derivative assets/liabilities
$1,518.8 $18.8 $ 1,537.6 $1,501.5 $4.3 $ 1,505.8
Less: Legally enforceable master netting agreements
(1,406.3) (1,406.3)
Less: Cash collateral applied
(58.3) (43.6)
Total derivative assets/liabilities
$ 73.0 $ 55.9
(1)
Represents the total contract/notional amount of derivative assets and liabilities outstanding.
(2)
Excludes $4.1 billion of long-term debt designated as a hedge of foreign currency risk.
Bank of America 2010 157