Bank of America 2010 Annual Report Download - page 73
Download and view the complete annual report
Please find page 73 of the 2010 Bank of America annual report below. You can navigate through the pages in the report by either clicking on the pages listed below, or by using the keyword search tool below to find specific information within the annual report.-
 1
1 -
2
-
3
-
4
-
5
-
6
-
7
-
8
-
9
-
10
-
11
-
12
-
13
-
14
-
15
-
16
-
17
-
18
-
19
-
20
-
21
-
22
-
23
-
24
-
25
-
26
-
27
-
28
-
29
-
30
-
31
-
32
-
33
-
34
-
35
-
36
-
37
-
38
-
39
-
40
-
41
-
42
-
43
-
44
-
45
-
46
-
47
-
48
-
49
-
50
-
51
-
52
-
53
-
54
-
55
-
56
-
57
-
58
-
59
-
60
-
61
-
62
-
 63
63 -
 64
64 -
 65
65 -
 66
66 -
 67
67 -
 68
68 -
 69
69 -
 70
70 -
 71
71 -
 72
72 -
 73
73 -
 74
74 -
 75
75 -
 76
76 -
 77
77 -
 78
78 -
 79
79 -
 80
80 -
 81
81 -
 82
82 -
 83
83 -
84
-
85
-
86
-
87
-
88
-
89
-
90
-
91
-
92
-
93
-
94
-
95
-
96
-
97
-
98
-
99
-
100
-
101
-
102
-
103
-
104
-
105
-
106
-
107
-
108
-
109
-
110
-
111
-
112
-
113
-
114
-
115
-
116
-
117
-
118
-
119
-
120
-
121
-
122
-
123
-
124
-
125
-
126
-
127
-
128
-
129
-
130
-
131
-
132
-
133
-
134
-
135
-
136
-
137
-
138
-
139
-
140
-
141
-
142
-
143
-
144
-
145
-
146
-
147
-
148
-
149
-
150
-
151
-
152
-
153
-
154
-
155
-
156
-
157
-
158
-
159
-
160
-
161
-
162
-
163
-
164
-
165
-
166
-
167
-
168
-
169
-
170
-
171
-
172
-
173
-
174
-
175
-
176
-
177
-
178
-
179
-
180
-
181
-
182
-
183
-
184
-
185
-
186
-
187
-
188
-
189
-
190
-
191
-
192
-
193
-
194
-
195
-
196
-
197
-
198
-
199
-
200
-
201
-
202
-
203
-
204
-
205
-
206
-
207
-
208
-
209
-
210
-
211
-
212
-
213
-
214
-
215
-
216
-
217
-
218
-
219
-
220
-
221
-
222
-
223
-
224
-
225
-
226
-
227
-
228
-
229
-
230
-
231
-
232
-
233
-
234
-
235
-
236
-
237
-
238
-
239
-
240
-
241
-
242
-
243
-
244
-
245
-
246
-
247
-
248
-
249
-
250
-
251
-
252
 |
 |

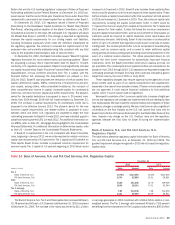
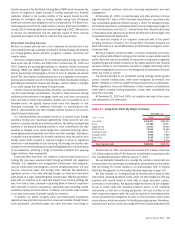
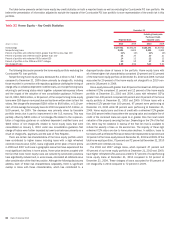
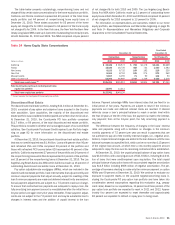
Common Stock Dividends
The table below is a summary of our declared quarterly cash dividends on
common stock during 2010 and through February 25, 2011.
Table 15 Common Stock Cash Dividend Summary
Declaration Date Record Date Payment Date
Dividend
Per Share
January 26, 2011 March 4, 2011 March 25, 2011 $0.01
October 25, 2010 December 3, 2010 December 24, 2010 0.01
July 28, 2010 September 3, 2010 September 24, 2010 0.01
April 28, 2010 June 4, 2010 June 25, 2010 0.01
January 27, 2010 March 5, 2010 March 26, 2010 0.01
Preferred Stock Issuances and Exchanges
In 2009, we completed an offer to exchange outstanding depositary shares of
portions of certain series of preferred stock up to approximately 200 million
shares of common stock at an average price of $12.70 per share. In addition,
we also entered into agreements with certain holders of other non-govern-
ment perpetual preferred shares to exchange their holdings of approximately
$10.9 billion aggregate liquidation preference of perpetual preferred stock
into approximately 800 million shares of common stock. In total, the ex-
change offer and these privately negotiated exchanges covered the exchange
of $14.8 billion aggregate liquidation preference of perpetual preferred stock
into 1.0 billion shares of common stock. In 2009, we recorded an increase to
retained earnings and net income applicable to common shareholders of
$576 million related to these exchanges. This represents the net of a
$2.6 billion benefit due to the excess of the carrying value of our non-
convertible preferred stock over the fair value of the common stock ex-
changed. This was partially offset by a $2.0 billion inducement to convertible
preferred shareholders representing the excess of the fair value of the
common stock exchanged, which was accounted for as an induced conversion
of convertible preferred stock, over the fair value of the common stock that
would have been issued under the original conversion terms.
On December 2, 2009, we received approval from the U.S. Treasury and
Federal Reserve to repay the U.S. government’s $45.0 billion preferred stock
investment provided under TARP. In accordance with the approval, on Decem-
ber 9, 2009, we repurchased all outstanding shares of Cumulative Perpetual
Preferred Stock Series N, Series Q and Series R issued to the U.S. Treasury as
part of the TARP. While participating in the TARP we recorded $7.4 billion in
dividends and accretion on the TARP Preferred Stock and repayment saved us
approximately $3.6 billion in annual dividends and accretion. We did not
repurchase the related common stock warrants issued to the U.S. Treasury in
connection with its TARP investment. The U.S. Treasury auctioned these
warrants in March 2010. For more detail on the TARP Preferred Stock, refer to
Note 15 – Shareholders’ Equity to the Consolidated Financial Statements.
We repurchased the TARP Preferred Stock through the use of $25.7 billion in
excess liquidity and $19.3 billion in proceeds from the sale of 1.3 billion units of
CES valued at $15.00 per unit. The CES consisted of depositary shares
representing interests in shares of Common Equivalent Junior Preferred Stock
Series S (Common Equivalent Stock) and warrants (Contingent Warrants) to
purchase an aggregate 60 million shares of the Corporation’s common stock.
Each depositary share represented a 1/1,000
th
interest in a share of Common
Equivalent Stock and each Contingent Warrant granted the holder the right to
purchase 0.0467 of a share of a common stock for $0.01 per share. Each
depositary share entitled the holder, through the depository, to a proportional
fractional interest in all rights and preferences of the Common Equivalent Stock,
including conversion, dividend, liquidation and voting rights.
The Corporation held a special meeting of stockholders on February 23,
2010 at which we obtained stockholder approval of an amendment to our
amended and restated certificate of incorporation to increase the number of
authorized shares of our common stock. Following effectiveness of the
amendment, on February 24, 2010, the Common Equivalent Stock converted
in full into our common stock and the Contingent Warrants automatically
expired without becoming exercisable, and the CES ceased to exist.
On October 15, 2010, all of the outstanding shares of the mandatory
convertible Preferred Stock, Series 2 and Series 3, of Merrill Lynch automat-
ically converted into an aggregate of 50 million shares of the Corporation’s
Common Stock in accordance with the terms of these preferred securities.
For more information on cash dividends declared on preferred stock, see
Table III.
Enterprise-wide Stress Testing
As a part of our core risk management practices, we conduct enterprise-wide
stress tests on a periodic basis to better understand earnings, capital and
liquidity sensitivities to certain economic and business scenarios, including
economic and market conditions that are more severe than anticipated.
These enterprise-wide stress tests provide an understanding of the potential
impacts from our risk profile to earnings, capital and liquidity, and serve as a
key component of our capital management practices. Scenarios are selected
by a group comprised of senior line of business, risk and finance executives.
Impacts to each line of business from each scenario are then determined and
analyzed, primarily leveraging the models and processes utilized in everyday
management routines. Impacts are assessed along with potential mitigating
actions that may be taken. Analysis from such stress scenarios is compiled
for and reviewed through our Risk Oversight Committee (ROC), Asset Liability
Market Risk Committee (ALMRC) and the Board’s Enterprise Risk Committee,
and serves to inform and be incorporated, along with other core business
processes, into decision-making by management and the Board. We have
made substantial investments to establish stress testing capabilities as a
core business process.
Liquidity Risk
Funding and Liquidity Risk Management
We define liquidity risk as the potential inability to meet our contractual and
contingent financial obligations, on- or off-balance sheet, as they come due.
Our primary liquidity objective is to ensure adequate funding for our busi-
nesses throughout market cycles, including periods of financial stress. To
achieve that objective, we analyze and monitor our liquidity risk, maintain
excess liquidity and access diverse funding sources including our stable
deposit base. We define excess liquidity as readily available assets, limited
to cash and high-quality, liquid, unencumbered securities that we can use to
meet our funding requirements as those obligations arise.
Global funding and liquidity risk management activities are centralized
within Corporate Treasury. We believe that a centralized approach to funding
and liquidity risk management enhances our ability to monitor liquidity re-
quirements, maximizes access to funding sources, minimizes borrowing
costs and facilitates timely responses to liquidity events.
The Enterprise Risk Committee approves the Corporation’s liquidity policy
and contingency funding plan, including establishing liquidity risk tolerance
levels. The ALMRC, in conjunction with the Board and its committees, monitors
our liquidity position and reviews the impact of strategic decisions on our
liquidity. ALMRC is responsible for managing liquidity risks and ensuring expo-
sures remain within the established tolerance levels. ALMRC delegates addi-
tional oversight responsibilities to the ROC, which reports to ALMRC. The ROC
reviews and monitors our liquidity position, cash flow forecasts, stress testing
scenarios and results, and implements our liquidity limits and guidelines. For
more information, refer to Board Oversight of Risk beginning on page 65.
Under this governance framework, we have developed certain funding and
liquidity risk management practices which include: maintaining excess
Bank of America 2010 71