Bank of America 2010 Annual Report Download - page 99
Download and view the complete annual report
Please find page 99 of the 2010 Bank of America annual report below. You can navigate through the pages in the report by either clicking on the pages listed below, or by using the keyword search tool below to find specific information within the annual report.-
 1
1 -
2
-
3
-
4
-
5
-
6
-
7
-
8
-
9
-
10
-
11
-
12
-
13
-
14
-
15
-
16
-
17
-
18
-
19
-
20
-
21
-
22
-
23
-
24
-
25
-
26
-
27
-
28
-
29
-
30
-
31
-
32
-
33
-
34
-
35
-
36
-
37
-
38
-
39
-
40
-
41
-
42
-
43
-
44
-
45
-
46
-
47
-
48
-
49
-
50
-
51
-
52
-
53
-
54
-
55
-
56
-
57
-
58
-
59
-
60
-
61
-
62
-
63
-
64
-
65
-
66
-
67
-
68
-
69
-
70
-
71
-
72
-
73
-
74
-
75
-
76
-
77
-
78
-
79
-
80
-
81
-
82
-
83
-
84
-
85
-
86
-
87
-
88
-
 89
89 -
 90
90 -
 91
91 -
 92
92 -
 93
93 -
 94
94 -
 95
95 -
 96
96 -
 97
97 -
 98
98 -
 99
99 -
 100
100 -
 101
101 -
 102
102 -
 103
103 -
 104
104 -
 105
105 -
 106
106 -
 107
107 -
 108
108 -
 109
109 -
110
-
111
-
112
-
113
-
114
-
115
-
116
-
117
-
118
-
119
-
120
-
121
-
122
-
123
-
124
-
125
-
126
-
127
-
128
-
129
-
130
-
131
-
132
-
133
-
134
-
135
-
136
-
137
-
138
-
139
-
140
-
141
-
142
-
143
-
144
-
145
-
146
-
147
-
148
-
149
-
150
-
151
-
152
-
153
-
154
-
155
-
156
-
157
-
158
-
159
-
160
-
161
-
162
-
163
-
164
-
165
-
166
-
167
-
168
-
169
-
170
-
171
-
172
-
173
-
174
-
175
-
176
-
177
-
178
-
179
-
180
-
181
-
182
-
183
-
184
-
185
-
186
-
187
-
188
-
189
-
190
-
191
-
192
-
193
-
194
-
195
-
196
-
197
-
198
-
199
-
200
-
201
-
202
-
203
-
204
-
205
-
206
-
207
-
208
-
209
-
210
-
211
-
212
-
213
-
214
-
215
-
216
-
217
-
218
-
219
-
220
-
221
-
222
-
223
-
224
-
225
-
226
-
227
-
228
-
229
-
230
-
231
-
232
-
233
-
234
-
235
-
236
-
237
-
238
-
239
-
240
-
241
-
242
-
243
-
244
-
245
-
246
-
247
-
248
-
249
-
250
-
251
-
252
 |
 |

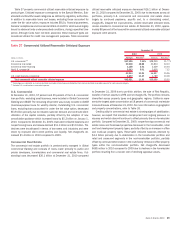
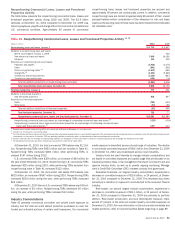
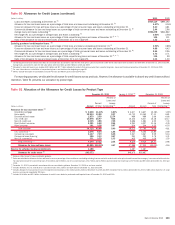
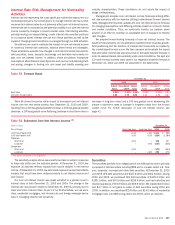
The notional amounts presented in Table 45 represent the total contract/
notional amount of credit derivatives outstanding and include both purchased
and written credit derivatives. The credit risk amounts are measured as the
net replacement cost, in the event the counterparties with contracts in a gain
position to us fail to perform under the terms of those contracts. For infor-
mation on the performance risk of our written credit derivatives, see Note 4 –
Derivatives to the Consolidated Financial Statements.
The credit risk amounts discussed on page 96 and noted in the table
below take into consideration the effects of legally enforceable master netting
agreements while amounts disclosed in Note 4 – Derivatives to the Consol-
idated Financial Statements are shown on a gross basis. Credit risk reflects
the potential benefit from offsetting exposure to non-credit derivative products
with the same counterparties that may be netted upon the occurrence of
certain events, thereby reducing the Corporation’s overall exposure.
Table 45 Credit Derivatives
(Dollars in millions)
Contract/
Notional Credit Risk
Contract/
Notional Credit Risk
2010 2009
December 31
Purchased credit derivatives:
Credit default swaps
$2,184,703 $18,150
$2,800,539 $25,964
Total return swaps/other
26,038 1,013
21,685 1,740
Total purchased credit derivatives
2,210,741 19,163
2,822,224 27,704
Written credit derivatives:
Credit default swaps
2,133,488 n/a
2,788,760 n/a
Total return swaps/other
22,474 n/a
33,109 n/a
Total written credit derivatives
2,155,962 n/a
2,821,869 n/a
Total credit derivatives
$4,366,703 $19,163
$5,644,093 $27,704
n/a = not applicable
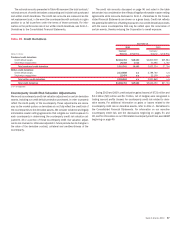
Counterparty Credit Risk Valuation Adjustments
We record a counterparty credit risk valuation adjustment on certain derivative
assets, including our credit default protection purchased, in order to properly
reflect the credit quality of the counterparty. These adjustments are neces-
sary as the market quotes on derivatives do not fully reflect the credit risk of
the counterparties to the derivative assets. We consider collateral and legally
enforceable master netting agreements that mitigate our credit exposure to
each counterparty in determining the counterparty credit risk valuation ad-
justment. All or a portion of these counterparty credit risk valuation adjust-
ments are reversed or otherwise adjusted in future periods due to changes in
the value of the derivative contract, collateral and creditworthiness of the
counterparty.
During 2010 and 2009, credit valuation gains (losses) of $731 million and
$3.1 billion ($(8) million and $1.7 billion, net of hedges) were recognized in
trading account profits (losses) for counterparty credit risk related to deriv-
ative assets. For additional information on gains or losses related to the
counterparty credit risk on derivative assets, refer to Note 4 – Derivatives to
the Consolidated Financial Statements. For information on our monoline
counterparty credit risk, see the discussions beginning on pages 51 and
90, and for information on our CDO-related counterparty credit risk, see GBAM
beginning on page 49.
Bank of America 2010 97