Bank of America 2010 Annual Report Download - page 110
Download and view the complete annual report
Please find page 110 of the 2010 Bank of America annual report below. You can navigate through the pages in the report by either clicking on the pages listed below, or by using the keyword search tool below to find specific information within the annual report.-
 1
1 -
2
-
3
-
4
-
5
-
6
-
7
-
8
-
9
-
10
-
11
-
12
-
13
-
14
-
15
-
16
-
17
-
18
-
19
-
20
-
21
-
22
-
23
-
24
-
25
-
26
-
27
-
28
-
29
-
30
-
31
-
32
-
33
-
34
-
35
-
36
-
37
-
38
-
39
-
40
-
41
-
42
-
43
-
44
-
45
-
46
-
47
-
48
-
49
-
50
-
51
-
52
-
53
-
54
-
55
-
56
-
57
-
58
-
59
-
60
-
61
-
62
-
63
-
64
-
65
-
66
-
67
-
68
-
69
-
70
-
71
-
72
-
73
-
74
-
75
-
76
-
77
-
78
-
79
-
80
-
81
-
82
-
83
-
84
-
85
-
86
-
87
-
88
-
89
-
90
-
91
-
92
-
93
-
94
-
95
-
96
-
97
-
98
-
99
-
 100
100 -
 101
101 -
 102
102 -
 103
103 -
 104
104 -
 105
105 -
 106
106 -
 107
107 -
 108
108 -
 109
109 -
 110
110 -
 111
111 -
 112
112 -
 113
113 -
 114
114 -
 115
115 -
 116
116 -
 117
117 -
 118
118 -
 119
119 -
 120
120 -
121
-
122
-
123
-
124
-
125
-
126
-
127
-
128
-
129
-
130
-
131
-
132
-
133
-
134
-
135
-
136
-
137
-
138
-
139
-
140
-
141
-
142
-
143
-
144
-
145
-
146
-
147
-
148
-
149
-
150
-
151
-
152
-
153
-
154
-
155
-
156
-
157
-
158
-
159
-
160
-
161
-
162
-
163
-
164
-
165
-
166
-
167
-
168
-
169
-
170
-
171
-
172
-
173
-
174
-
175
-
176
-
177
-
178
-
179
-
180
-
181
-
182
-
183
-
184
-
185
-
186
-
187
-
188
-
189
-
190
-
191
-
192
-
193
-
194
-
195
-
196
-
197
-
198
-
199
-
200
-
201
-
202
-
203
-
204
-
205
-
206
-
207
-
208
-
209
-
210
-
211
-
212
-
213
-
214
-
215
-
216
-
217
-
218
-
219
-
220
-
221
-
222
-
223
-
224
-
225
-
226
-
227
-
228
-
229
-
230
-
231
-
232
-
233
-
234
-
235
-
236
-
237
-
238
-
239
-
240
-
241
-
242
-
243
-
244
-
245
-
246
-
247
-
248
-
249
-
250
-
251
-
252
 |
 |
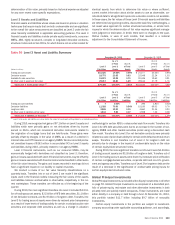
During 2010, we entered into a series of transactions in our AFS debt
securities portfolio that involved securitizations as well as sales of non-agency
RMBS. These transactions were initiated following a review of corporate risk
objectives in light of proposed Basel regulatory capital changes and liquidity
targets. For more information on the proposed regulatory capital changes,
see Capital Management – Regulatory Capital Changes beginning on page 68.
During 2010, the carrying value of the non-agency RMBS portfolio was
reduced $14.5 billion primarily as a result of the aforementioned sales
and securitizations as well as paydowns. We recognized net losses of
$922 million on the series of transactions in the AFS debt securities portfolio,
and improved the overall credit quality of the remaining portfolio such that the
percentage of the non-agency RMBS portfolio that is below investment-grade
was reduced significantly.
Accumulated OCI includes after-tax net unrealized gains of $7.4 billion and
$1.5 billion at December 31, 2010 and 2009, comprised primarily of after-tax
net unrealized gains of $714 million and after-tax net unrealized losses of
$628 million related to AFS debt securities and after-tax net unrealized gains
of $6.7 billion and $2.1 billion related to AFS equity securities. The 2010
unrealized gain on marketable equity securities was related to our investment
in CCB. See Note 5 – Securities to the Consolidated Financial Statements for
further discussion on marketable equity securities. Total market value of the
AFS debt securities was $337.6 billion and $301.6 billion at December 31,
2010 and 2009 with a weighted-average duration of 4.9 and 4.5 years, and
primarily relates to our MBS and U.S. Treasury portfolio. The amount of pre-tax
accumulated OCI related to AFS debt securities increased by $2.2 billion
during 2010 to $1.1 billion, primarily due to sales of non-agency CMO
positions.
We recognized $967 million of OTTI losses through earnings on AFS debt
securities in 2010 compared to $2.8 billion in 2009. We also recognized
$3 million of OTTI losses on AFS marketable equity securities during 2010
compared to $326 million in 2009.
The recognition of impairment losses on AFS debt and marketable equity
securities is based on a variety of factors, including the length of time and
extent to which the market value has been less than cost, the financial
condition of the issuer of the security including credit ratings and the specific
events affecting the operations of the issuer, underlying assets that collat-
eralize the debt security, other industry and macroeconomic conditions, and
our intent and ability to hold the security to recovery. We do not intend to sell
securities with unrealized losses and it is not more-likely-than-not that we will
be required to sell those securities before recovery of amortized cost. Based
on our evaluation of these and other relevant factors, and after consideration
of the losses described in the paragraph above, we do not believe that the AFS
debt and marketable equity securities that are in an unrealized loss position at
December 31, 2010 are other-than-temporarily impaired.
Residential Mortgage Portfolio
At December 31, 2010 and 2009, residential mortgages were $258.0 billion
and $242.1 billion. During 2010 and 2009, we retained $63.8 billion and
$26.6 billion in first mortgages originated by Home Loans & Insurance.
Outstanding residential mortgage loans increased $15.8 billion in 2010
compared to 2009 as new FHA insured origination volume was partially offset
by paydowns, the sale of $10.8 billion of residential mortgages related to First
Republic Bank, transfers to foreclosed properties and charge-offs. In addition,
FHA repurchases of delinquent loans pursuant to our servicing agreements
with GNMA also increased the residential mortgage portfolio during 2010.
During 2010 and 2009, we securitized $2.4 billion and $14.0 billion of
residential mortgage loans into MBS which we retained. We recognized gains
of $68 million on securitizations completed during 2010. For more informa-
tion on these securitizations, see Note 8 – Securitizations and Other Variable
Interest Entities to the Consolidated Financial Statements. During 2010 and
2009, we had no purchases of residential mortgages related to ALM activ-
ities. We sold $443 million of residential mortgages during 2010, of which
$432 million were originated residential mortgages and $11 million were
previously purchased from third parties. Net gains on these transactions were
$21 million. This compares to sales of $5.9 billion of residential mortgages
during 2009 of which $5.1 billion were originated residential mortgages and
$771 million were previously purchased from third parties. These sales
resulted in gains of $47 million. We received paydowns of $38.2 billion
and $42.3 billion in 2010 and 2009.
Interest Rate and Foreign Exchange Derivative Contracts
Interest rate and foreign exchange derivative contracts are utilized in our ALM
activities and serve as an efficient tool to manage our interest rate and foreign
exchange risk. We use derivatives to hedge the variability in cash flows or
changes in fair value on our balance sheet due to interest rate and foreign
exchange components. For additional information on our hedging activities,
see Note 4 – Derivatives to the Consolidated Financial Statements.
Our interest rate contracts are generally non-leveraged generic interest
rate and foreign exchange basis swaps, options, futures and forwards. In
addition, we use foreign exchange contracts, including cross-currency interest
rate swaps, foreign currency forward contracts and options to mitigate the
foreign exchange risk associated with foreign currency-denominated assets
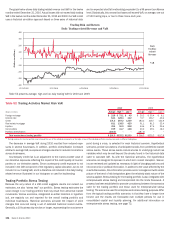
and liabilities. Table 55 shows the notional amounts, fair value, weighted-
average receive-fixed and pay-fixed rates, expected maturity and estimated
duration of our open ALM derivatives at December 31, 2010 and 2009. These
amounts do not include derivative hedges on our MSRs.
Changes to the composition of our derivatives portfolio during 2010
reflect actions taken for interest rate and foreign exchange rate risk manage-
ment. The decisions to reposition our derivatives portfolio are based upon the
current assessment of economic and financial conditions including the inter-
est rate and foreign currency environments, balance sheet composition and
trends, and the relative mix of our cash and derivative positions. The notional
amount of our option positions increased to $6.6 billion at December 31,
2010 from $6.5 billion at December 31, 2009. Our interest rate swap
positions, including foreign exchange contracts, were a net receive-fixed
position of $6.4 billion and $52.2 billion at December 31, 2010 and
2009. The decrease in the net notional levels of our interest rate swap
position was driven by the net addition of $51.6 billion in pay-fixed swaps and
$11.5 billion in foreign currency-denominated receive-fixed swaps, offset by a
reduction of $5.6 billion in U.S. dollar-denominated receive-fixed swaps. The
notional amount of our foreign exchange basis swaps was $235.2 billion and
$122.8 billion at December 31, 2010 and 2009. The $112.4 billion notional
change was primarily due to new trade activity during 2010 to mitigate cross-
currency basis risk on our economic hedge portfolio. The increase in pay-fixed
swaps resulted from hedging newly purchased U.S. Treasury Bonds with
swaps and entering into additional pay-fixed swaps to hedge variable rate
short-term liabilities. Our futures and forwards net notional position, which
reflects the net of long and short positions, was a short position of $280 mil-
lion at December 31, 2010 compared to a long position of $10.6 billion at
December 31, 2009.
108 Bank of America 2010