Bank of America 2010 Annual Report Download - page 246
Download and view the complete annual report
Please find page 246 of the 2010 Bank of America annual report below. You can navigate through the pages in the report by either clicking on the pages listed below, or by using the keyword search tool below to find specific information within the annual report.-
 1
1 -
2
-
3
-
4
-
5
-
6
-
7
-
8
-
9
-
10
-
11
-
12
-
13
-
14
-
15
-
16
-
17
-
18
-
19
-
20
-
21
-
22
-
23
-
24
-
25
-
26
-
27
-
28
-
29
-
30
-
31
-
32
-
33
-
34
-
35
-
36
-
37
-
38
-
39
-
40
-
41
-
42
-
43
-
44
-
45
-
46
-
47
-
48
-
49
-
50
-
51
-
52
-
53
-
54
-
55
-
56
-
57
-
58
-
59
-
60
-
61
-
62
-
63
-
64
-
65
-
66
-
67
-
68
-
69
-
70
-
71
-
72
-
73
-
74
-
75
-
76
-
77
-
78
-
79
-
80
-
81
-
82
-
83
-
84
-
85
-
86
-
87
-
88
-
89
-
90
-
91
-
92
-
93
-
94
-
95
-
96
-
97
-
98
-
99
-
100
-
101
-
102
-
103
-
104
-
105
-
106
-
107
-
108
-
109
-
110
-
111
-
112
-
113
-
114
-
115
-
116
-
117
-
118
-
119
-
120
-
121
-
122
-
123
-
124
-
125
-
126
-
127
-
128
-
129
-
130
-
131
-
132
-
133
-
134
-
135
-
136
-
137
-
138
-
139
-
140
-
141
-
142
-
143
-
144
-
145
-
146
-
147
-
148
-
149
-
150
-
151
-
152
-
153
-
154
-
155
-
156
-
157
-
158
-
159
-
160
-
161
-
162
-
163
-
164
-
165
-
166
-
167
-
168
-
169
-
170
-
171
-
172
-
173
-
174
-
175
-
176
-
177
-
178
-
179
-
180
-
181
-
182
-
183
-
184
-
185
-
186
-
187
-
188
-
189
-
190
-
191
-
192
-
193
-
194
-
195
-
196
-
197
-
198
-
199
-
200
-
201
-
202
-
203
-
204
-
205
-
206
-
207
-
208
-
209
-
210
-
211
-
212
-
213
-
214
-
215
-
216
-
217
-
218
-
219
-
220
-
221
-
222
-
223
-
224
-
225
-
226
-
227
-
228
-
229
-
230
-
231
-
232
-
233
-
234
-
235
-
 236
236 -
 237
237 -
 238
238 -
 239
239 -
 240
240 -
 241
241 -
 242
242 -
 243
243 -
 244
244 -
 245
245 -
 246
246 -
 247
247 -
 248
248 -
 249
249 -
 250
250 -
 251
251 -
 252
252
 |
 |

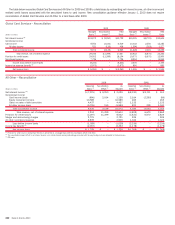
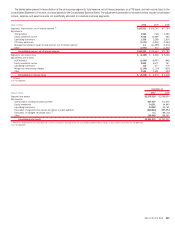
NOTE 28 Performance by Geographical Area
Since the Corporation’s operations are highly integrated, certain asset, liability, income and expense amounts must be allocated to arrive at total assets, total
revenue, net of interest expense, income (loss) before income taxes and net income (loss) by geographic area. The Corporation identifies its geographic
performance based on the business unit structure used to manage the capital or expense deployed in the region as applicable. This requires certain judgments
related to the allocation of revenue so that revenue can be appropriately matched with the related expense or capital deployed in the region.
(Dollars in millions)
Year Total Assets
(1)
Total
Revenue, Net
of Interest
Expense
(2)
Income
(Loss) Before
Income Taxes
Net Income
(Loss)
December 31 Year Ended December 31
U.S.
(3)
2010 $1,954,517 $ 88,679 $ (5,370) $(4,511)
2009 1,847,165 98,278 (6,901) (1,025)
2008 67,549 3,289 3,254
Asia
(4)
2010 106,186 6,115 1,380 869
2009 118,921 10,685 8,096 5,101
2008 1,770 1,207 761
Europe, Middle East and Africa
2010 186,045 12,369 1,273 525
2009 239,374 9,085 2,295 1,652
2008 3,020 (456) (252)
Latin America and the Caribbean
2010 18,161 3,057 1,394 879
2009 24,772 1,595 870 548
2008 443 388 245
Total Non-U.S.
2010 310,392 21,541 4,047 2,273
2009 383,067 21,365 11,261 7,301
2008 5,233 1,139 754
Total Consolidated 2010 $2,264,909 $110,220 $ (1,323) $(2,238)
2009 2,230,232 119,643 4,360 6,276
2008 72,782 4,428 4,008
(1)
Total assets include long-lived assets, which are primarily located in the U.S.
(2)
There were no material intercompany revenues between geographic regions for any of the periods presented.
(3)
Includes the Corporation’s Canadian operations, which had total assets of $16.1 billion and $31.1 billion at December 31, 2010 and 2009; total revenue, net of interest expense of $1.5 billion, $2.5 billion and $1.2 billion; income
before income taxes of $459 million, $723 million and $552 million; and net income of $328 million, $488 million and $404 million for 2010, 2009 and 2008, respectively.
(4)
The year ended December 31, 2009 amount includes pre-tax gains of $7.3 billion ($4.6 billion net-of-tax) on the sale of common shares of the Corporation’s initial investment in CCB.
244 Bank of America 2010