Bank of America 2010 Annual Report Download - page 47
Download and view the complete annual report
Please find page 47 of the 2010 Bank of America annual report below. You can navigate through the pages in the report by either clicking on the pages listed below, or by using the keyword search tool below to find specific information within the annual report.-
 1
1 -
2
-
3
-
4
-
5
-
6
-
7
-
8
-
9
-
10
-
11
-
12
-
13
-
14
-
15
-
16
-
17
-
18
-
19
-
20
-
21
-
22
-
23
-
24
-
25
-
26
-
27
-
28
-
29
-
30
-
31
-
32
-
33
-
34
-
35
-
36
-
 37
37 -
 38
38 -
 39
39 -
 40
40 -
 41
41 -
 42
42 -
 43
43 -
 44
44 -
 45
45 -
 46
46 -
 47
47 -
 48
48 -
 49
49 -
 50
50 -
 51
51 -
 52
52 -
 53
53 -
 54
54 -
 55
55 -
 56
56 -
 57
57 -
58
-
59
-
60
-
61
-
62
-
63
-
64
-
65
-
66
-
67
-
68
-
69
-
70
-
71
-
72
-
73
-
74
-
75
-
76
-
77
-
78
-
79
-
80
-
81
-
82
-
83
-
84
-
85
-
86
-
87
-
88
-
89
-
90
-
91
-
92
-
93
-
94
-
95
-
96
-
97
-
98
-
99
-
100
-
101
-
102
-
103
-
104
-
105
-
106
-
107
-
108
-
109
-
110
-
111
-
112
-
113
-
114
-
115
-
116
-
117
-
118
-
119
-
120
-
121
-
122
-
123
-
124
-
125
-
126
-
127
-
128
-
129
-
130
-
131
-
132
-
133
-
134
-
135
-
136
-
137
-
138
-
139
-
140
-
141
-
142
-
143
-
144
-
145
-
146
-
147
-
148
-
149
-
150
-
151
-
152
-
153
-
154
-
155
-
156
-
157
-
158
-
159
-
160
-
161
-
162
-
163
-
164
-
165
-
166
-
167
-
168
-
169
-
170
-
171
-
172
-
173
-
174
-
175
-
176
-
177
-
178
-
179
-
180
-
181
-
182
-
183
-
184
-
185
-
186
-
187
-
188
-
189
-
190
-
191
-
192
-
193
-
194
-
195
-
196
-
197
-
198
-
199
-
200
-
201
-
202
-
203
-
204
-
205
-
206
-
207
-
208
-
209
-
210
-
211
-
212
-
213
-
214
-
215
-
216
-
217
-
218
-
219
-
220
-
221
-
222
-
223
-
224
-
225
-
226
-
227
-
228
-
229
-
230
-
231
-
232
-
233
-
234
-
235
-
236
-
237
-
238
-
239
-
240
-
241
-
242
-
243
-
244
-
245
-
246
-
247
-
248
-
249
-
250
-
251
-
252
 |
 |

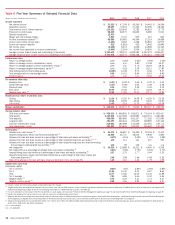
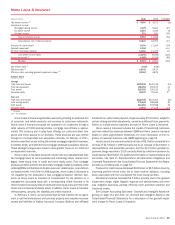
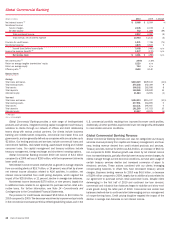
Home Loans & Insurance
(Dollars in millions)
2010 2009 % Change
Net interest income
(1)
$4,690
$ 4,975 (6)%
Noninterest income:
Mortgage banking income
3,079
9,321 (67)
Insurance income
2,257
2,346 (4)
All other income
621
261 138
Total noninterest income
5,957
11,928 (50)
Total revenue, net of interest expense
10,647
16,903 (37)
Provision for credit losses
8,490
11,244 (24)
Goodwill impairment
2,000
–n/m
All other noninterest expense
13,163
11,705 12
Loss before income taxes
(13,006)
(6,046) (115)
Income tax benefit
(1)
(4,085)
(2,195) (86)
Net loss
$ (8,921)
$ (3,851) (132)
Net interest yield
(1)
2.52%
2.58%
Efficiency ratio
(1)
142.42
69.25
Efficiency ratio, excluding goodwill impairment charge
(1)
123.63
69.25
Balance Sheet
Average
Total loans and leases
$129,236
$130,519 (1)%
Total earning assets
186,455
193,152 (3)
Total assets
226,352
230,123 (2)
Allocated equity
26,170
20,530 27
Year end
Total loans and leases
$122,935
$131,302 (6)%
Total earning assets
173,033
188,349 (8)
Total assets
213,455
232,588 (8)
Allocated equity
23,542
27,148 (13)
(1)
FTE basis
n/m = not meaningful
Home Loans & Insurance generates revenue by providing an extensive line
of consumer real estate products and services to customers nationwide.
Home Loans & Insurance products are available to our customers through a
retail network of 5,900 banking centers, mortgage loan officers in approxi-
mately 750 locations and a sales force offering our customers direct tele-
phone and online access to our products. These products are also offered
through our correspondent loan acquisition channels. On February 4, 2011,
we announced that we are exiting the reverse mortgage origination business.
In October 2010, we exited the first mortgage wholesale acquisition channel.
These strategic changes were made to allow greater focus on our retail and
correspondent channels.
Home Loans & Insurance products include fixed and adjustable-rate first-
lien mortgage loans for home purchase and refinancing needs, reverse mort-
gages, home equity lines of credit and home equity loans. First mortgage
products are either sold into the secondary mortgage market to investors, while
retaining MSRs and the Bank of America customer relationships, or are held on
our balance sheet in All Other for ALM purposes. Home Loans & Insurance is
not impacted by the Corporation’s first mortgage production retention deci-
sions as Home Loans & Insurance is compensated for the decision on a
management accounting basis with a corresponding offset recorded in All
Other. Funded home equity lines of credit and home equity loans are held on the
Home Loans & Insurance balance sheet. In addition, Home Loans & Insurance
offers property, casualty, life, disability and credit insurance.
On February 3, 2011, we announced that we had entered into an agree-
ment to sell the lender-placed and voluntary property and casualty insurance
assets and liabilities of Balboa Insurance Company (Balboa) and affiliated
entities for an upfront cash payment of approximately $700 million, subject to
certain closing and other adjustments, as well as additional future payments.
Balboa is a wholly-owned subsidiary and part of Home Loans & Insurance.
Home Loans & Insurance includes the impact of transferring customers
and their related loan balances between GWIM and Home Loans & Insurance
based on client segmentation thresholds. For more information on the mi-
gration of customer balances, see GWIM beginning on page 52.
Home Loans & Insurance recorded a net loss of $8.9 billion compared to a
net loss of $3.9 billion in 2009 primarily due to an increase of $4.9 billion in
representations and warranties provision and the $2.0 billion goodwill im-
pairment charge recorded in 2010, partially offset by a decline in provision for
credit losses of $2.8 billion. For additional information on representations and
warranties, see Note 9 – Representations and Warranties Obligations and
Corporate Guarantees to the Consolidated Financial Statements and Repre-
sentations and Warranties on page 56.
Provision for credit losses decreased $2.8 billion to $8.5 billion driven by
improving portfolio trends which led to lower reserve additions, including
those associated with the Countrywide PCI home equity portfolio.
Noninterest expense increased $3.5 billion primarily due to the goodwill
impairment charge, higher litigation expense and default-related and other
loss mitigation expenses, partially offset by lower production expense and
insurance losses.
See Complex Accounting Estimates – Goodwill and Intangible Assets be-
ginning on page 114 and Note 10 – Goodwill and Intangible Assets to the
Consolidated Financial Statements for a discussion of the goodwill impair-
ment charge for Home Loans & Insurance.
Bank of America 2010 45