Bank of America 2010 Annual Report Download - page 45
Download and view the complete annual report
Please find page 45 of the 2010 Bank of America annual report below. You can navigate through the pages in the report by either clicking on the pages listed below, or by using the keyword search tool below to find specific information within the annual report.-
 1
1 -
2
-
3
-
4
-
5
-
6
-
7
-
8
-
9
-
10
-
11
-
12
-
13
-
14
-
15
-
16
-
17
-
18
-
19
-
20
-
21
-
22
-
23
-
24
-
25
-
26
-
27
-
28
-
29
-
30
-
31
-
32
-
33
-
34
-
 35
35 -
 36
36 -
 37
37 -
 38
38 -
 39
39 -
 40
40 -
 41
41 -
 42
42 -
 43
43 -
 44
44 -
 45
45 -
 46
46 -
 47
47 -
 48
48 -
 49
49 -
 50
50 -
 51
51 -
 52
52 -
 53
53 -
 54
54 -
 55
55 -
56
-
57
-
58
-
59
-
60
-
61
-
62
-
63
-
64
-
65
-
66
-
67
-
68
-
69
-
70
-
71
-
72
-
73
-
74
-
75
-
76
-
77
-
78
-
79
-
80
-
81
-
82
-
83
-
84
-
85
-
86
-
87
-
88
-
89
-
90
-
91
-
92
-
93
-
94
-
95
-
96
-
97
-
98
-
99
-
100
-
101
-
102
-
103
-
104
-
105
-
106
-
107
-
108
-
109
-
110
-
111
-
112
-
113
-
114
-
115
-
116
-
117
-
118
-
119
-
120
-
121
-
122
-
123
-
124
-
125
-
126
-
127
-
128
-
129
-
130
-
131
-
132
-
133
-
134
-
135
-
136
-
137
-
138
-
139
-
140
-
141
-
142
-
143
-
144
-
145
-
146
-
147
-
148
-
149
-
150
-
151
-
152
-
153
-
154
-
155
-
156
-
157
-
158
-
159
-
160
-
161
-
162
-
163
-
164
-
165
-
166
-
167
-
168
-
169
-
170
-
171
-
172
-
173
-
174
-
175
-
176
-
177
-
178
-
179
-
180
-
181
-
182
-
183
-
184
-
185
-
186
-
187
-
188
-
189
-
190
-
191
-
192
-
193
-
194
-
195
-
196
-
197
-
198
-
199
-
200
-
201
-
202
-
203
-
204
-
205
-
206
-
207
-
208
-
209
-
210
-
211
-
212
-
213
-
214
-
215
-
216
-
217
-
218
-
219
-
220
-
221
-
222
-
223
-
224
-
225
-
226
-
227
-
228
-
229
-
230
-
231
-
232
-
233
-
234
-
235
-
236
-
237
-
238
-
239
-
240
-
241
-
242
-
243
-
244
-
245
-
246
-
247
-
248
-
249
-
250
-
251
-
252
 |
 |

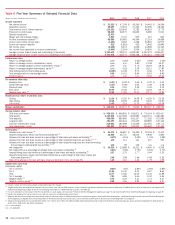
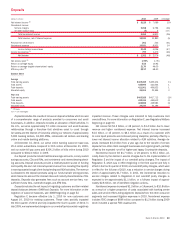
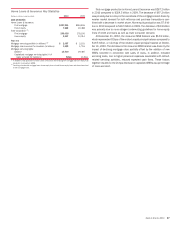
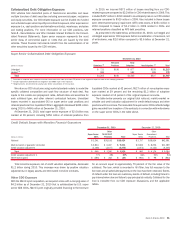
Deposits
(Dollars in millions)
2010 2009 % Change
Net interest income
(1)
$8,128
$ 7,089 15%
Noninterest income:
Service charges
5,058
6,796 (26)
All other income (loss)
(5)
5n/m
Total noninterest income
5,053
6,801 (26)
Total revenue, net of interest expense
13,181
13,890 (5)
Provision for credit losses
201
343 (41)
Noninterest expense
10,831
9,501 14
Income before income taxes
2,149
4,046 (47)
Income tax expense
(1)
797
1,470 (46)
Net income
$1,352
$ 2,576 (48)
Net interest yield
(1)
1.99%
1.75%
Return on average equity
5.58
10.92
Return on average tangible shareholders’ equity
21.70
46.00
Efficiency ratio
(1)
82.17
68.40
Balance Sheet
Average
Total earning assets
$409,359
$405,104 1%
Total assets
435,994
431,564 1
Total deposits
411,001
406,823 1
Allocated equity
24,204
23,594 3
Year end
Total earning assets
$403,926
$417,713 (3)%
Total assets
432,334
444,612 (3)
Total deposits
406,856
419,583 (3)
Allocated equity
24,273
24,186 –
(1)
FTE basis
n/m = not meaningful
Deposits includes the results of consumer deposit activities which consist
of a comprehensive range of products provided to consumers and small
businesses. In addition, Deposits includes an allocation of ALM activities. In
the U.S., we serve approximately 57 million consumer and small business
relationships through a franchise that stretches coast to coast through
32 states and the District of Columbia utilizing our network of approximately
5,900 banking centers, 18,000 ATMs, nationwide call centers and leading
online and mobile banking platforms.
At December 31, 2010, our active online banking customer base was
29.3 million subscribers compared to 29.6 million at December 31, 2009,
and our active bill pay users paid $304.3 billion of bills online during 2010
compared to $302.4 billion in 2009.
Our deposit products include traditional savings accounts, money market
savings accounts, CDs and IRAs, and noninterest- and interest-bearing check-
ing accounts. Deposit products provide a relatively stable source of funding
and liquidity. We earn net interest spread revenue from investing this liquidity
in earning assets through client-facing lending and ALM activities. The revenue
is allocated to the deposit products using our funds transfer pricing process
which takes into account the interest rates and maturity characteristics of the
deposits. Deposits also generates fees such as account service fees, non-
sufficient funds fees, overdraft charges and ATM fees.
Deposits includes the net impact of migrating customers and their related
deposit balances between GWIM and Deposits. For more information on the
migration of customer balances, see GWIM beginning on page 52.
Regulation E became effective July 1, 2010 for new customers and
August 16, 2010 for existing customers. These rules partially impacted
the third quarter of 2010 and fully impacted the fourth quarter of 2010. In
late 2009, we implemented changes in our overdraft policies which negatively
impacted revenue. These changes were intended to help customers limit
overdraft fees. For more information on Regulation E, see Regulatory Matters
beginning on page 60.
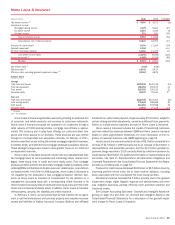
Net income fell $1.2 billion, or 48 percent, to $1.4 billion due to lower
revenue and higher noninterest expense. Net interest income increased
$1.0 billion, or 15 percent, to $8.1 billion as a result of a customer shift
to more liquid products and continued pricing discipline, partially offset by a
lower net interest income allocation related to ALM activities. Average de-
posits increased $4.2 billion from a year ago due to the transfer of certain
deposits from other client managed businesses and organic growth, partially
offset by the expected run-off of higher-cost legacy Countrywide deposits.
Noninterest income fell $1.7 billion, or 26 percent, to $5.1 billion, pri-
marily driven by the decline in service charges due to the implementation of
Regulation E and the impact of our overdraft policy changes. The impact of
Regulation E, which was in effect beginning in the third quarter and fully in
effect in the fourth quarter of 2010, and overdraft policy changes, which were
in effect for the full year of 2010, was a reduction in service charges during
2010 of approximately $1.7 billion. In 2011, the incremental reduction to
service charges related to Regulation E and overdraft policy changes is
expected to be approximately $1.1 billion, or a full-year impact of approxi-
mately $2.8 billion, net of identified mitigation actions.
Noninterest expense increased $1.3 billion, or 14 percent, to $10.8 billion
as a result of a higher proportion of costs associated with banking center
sales and service efforts being aligned to Deposits from the other consumer
segments and increased litigation expenses in 2010. Noninterest expense
includes FDIC charges of $896 million compared to $1.2 billion during 2009
which included a special FDIC assessment.
Bank of America 2010 43