Bank of America 2010 Annual Report Download - page 107
Download and view the complete annual report
Please find page 107 of the 2010 Bank of America annual report below. You can navigate through the pages in the report by either clicking on the pages listed below, or by using the keyword search tool below to find specific information within the annual report.-
 1
1 -
2
-
3
-
4
-
5
-
6
-
7
-
8
-
9
-
10
-
11
-
12
-
13
-
14
-
15
-
16
-
17
-
18
-
19
-
20
-
21
-
22
-
23
-
24
-
25
-
26
-
27
-
28
-
29
-
30
-
31
-
32
-
33
-
34
-
35
-
36
-
37
-
38
-
39
-
40
-
41
-
42
-
43
-
44
-
45
-
46
-
47
-
48
-
49
-
50
-
51
-
52
-
53
-
54
-
55
-
56
-
57
-
58
-
59
-
60
-
61
-
62
-
63
-
64
-
65
-
66
-
67
-
68
-
69
-
70
-
71
-
72
-
73
-
74
-
75
-
76
-
77
-
78
-
79
-
80
-
81
-
82
-
83
-
84
-
85
-
86
-
87
-
88
-
89
-
90
-
91
-
92
-
93
-
94
-
95
-
96
-
 97
97 -
 98
98 -
 99
99 -
 100
100 -
 101
101 -
 102
102 -
 103
103 -
 104
104 -
 105
105 -
 106
106 -
 107
107 -
 108
108 -
 109
109 -
 110
110 -
 111
111 -
 112
112 -
 113
113 -
 114
114 -
 115
115 -
 116
116 -
 117
117 -
118
-
119
-
120
-
121
-
122
-
123
-
124
-
125
-
126
-
127
-
128
-
129
-
130
-
131
-
132
-
133
-
134
-
135
-
136
-
137
-
138
-
139
-
140
-
141
-
142
-
143
-
144
-
145
-
146
-
147
-
148
-
149
-
150
-
151
-
152
-
153
-
154
-
155
-
156
-
157
-
158
-
159
-
160
-
161
-
162
-
163
-
164
-
165
-
166
-
167
-
168
-
169
-
170
-
171
-
172
-
173
-
174
-
175
-
176
-
177
-
178
-
179
-
180
-
181
-
182
-
183
-
184
-
185
-
186
-
187
-
188
-
189
-
190
-
191
-
192
-
193
-
194
-
195
-
196
-
197
-
198
-
199
-
200
-
201
-
202
-
203
-
204
-
205
-
206
-
207
-
208
-
209
-
210
-
211
-
212
-
213
-
214
-
215
-
216
-
217
-
218
-
219
-
220
-
221
-
222
-
223
-
224
-
225
-
226
-
227
-
228
-
229
-
230
-
231
-
232
-
233
-
234
-
235
-
236
-
237
-
238
-
239
-
240
-
241
-
242
-
243
-
244
-
245
-
246
-
247
-
248
-
249
-
250
-
251
-
252
 |
 |
authority for Global Markets Risk Management including trading risk manage-
ment. The GRC’s focus is to take a forward-looking view of the primary credit
and market risks impacting GBAM and prioritize those that need a proactive
risk mitigation strategy. Market risks that impact lines of business outside of
GBAM are monitored and governed by their respective governance authorities.
The GRC monitors significant daily revenues and losses by business and
the primary drivers of the revenues or losses. Thresholds are in place for each
of our businesses in order to determine if the revenue or loss is considered to
be significant for that business. If any of the thresholds are exceeded, an
explanation of the variance is provided to the GRC. The thresholds are
developed in coordination with the respective risk managers to highlight
those revenues or losses that exceed what is considered to be normal daily
income statement volatility.
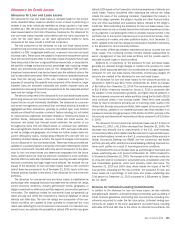
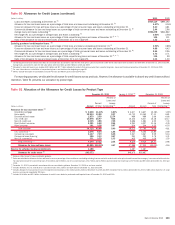
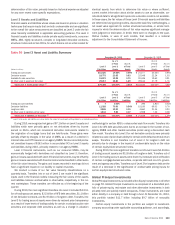
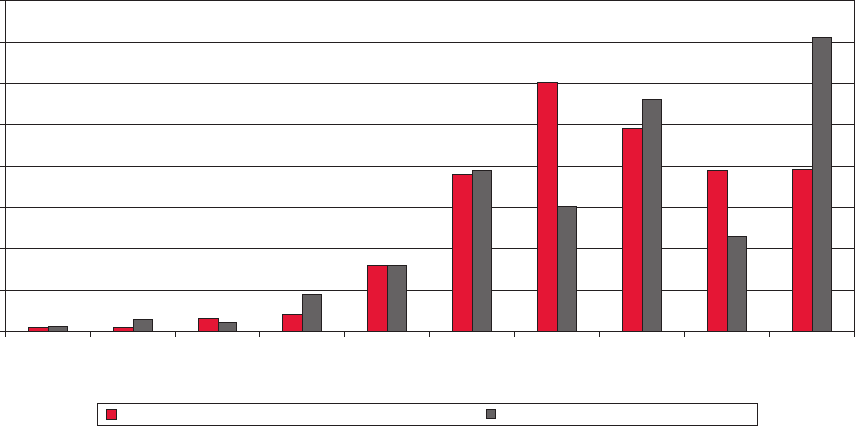
The histogram below is a graphic depiction of trading volatility and illus-
trates the daily level of trading-related revenue for the twelve months ended
December 31, 2010, as compared with the twelve months ended Decem-
ber 31, 2009. During the twelve months ended December 31, 2010, positive
trading-related revenue was recorded for 90 percent of the trading days of
which 75 percent were daily trading gains of over $25 million, four percent of
the trading days had losses greater than $25 million and the largest loss was
$102 million. This can be compared to the twelve months ended Decem-
ber 31, 2009, where positive trading-related revenue was recorded for 88 per-
cent of the trading days of which 72 percent were daily trading gains of over
$25 million, six percent of the trading days had losses greater than $25 mil-
lion and the largest loss was $100 million.
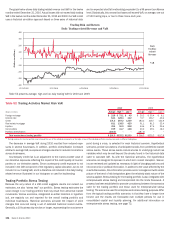
Histogram of Daily Trading-related Revenue
< -100 -100 to -75 -75 to -50 -50 to -25 -25 to 0 0 to 25 25 to 50 50 to 75 75 to 100 > 100
Revenue (dollars in millions)
Twelve Months Ended December 31, 2010 Twelve Months Ended December 31, 2009
80
70
60
50
40
30
20
10
0
Number of Days
To evaluate risk in our trading activities, we focus on the actual and
potential volatility of individual positions as well as portfolios. VaR is a key
statistic used to measure market risk. In order to manage day-to-day risks,
VaR is subject to trading limits both for our overall trading portfolio and within
individual businesses. All limit excesses are communicated to management
for review.
A VaR model simulates the value of a portfolio under a range of hypo-
thetical scenarios in order to generate a distribution of potential gains and
losses. VaR represents the worst loss the portfolio is expected to experience
based on historical trends with a given level of confidence and depends on the
volatility of the positions in the portfolio and on how strongly their risks are
correlated. Within any VaR model, there are significant and numerous as-
sumptions that will differ from company to company. In addition, the accuracy
of a VaR model depends on the availability and quality of historical data for
each of the positions in the portfolio. A VaR model may require additional
modeling assumptions for new products that do not have extensive historical
price data or for illiquid positions for which accurate daily prices are not
consistently available.
A VaR model is an effective tool in estimating ranges of potential gains and
losses on our trading portfolios. There are however many limitations inherent
in a VaR model as it utilizes historical results over a defined time period to
estimate future performance. Historical results may not always be indicative
of future results and changes in market conditions or in the composition of the
underlying portfolio could have a material impact on the accuracy of the VaR
model. In order for the VaR model to reflect current market conditions, we
update the historical data underlying our VaR model on a bi-weekly basis and
regularly review the assumptions underlying the model.
We continually review, evaluate and enhance our VaR model so that it
reflects the material risks in our trading portfolio. Nevertheless, due to the
limitations mentioned above, we have historically used the VaR model as only
one of the components in managing our trading risk and also use other
techniques such as stress testing and desk level limits. Periods of extreme
market stress influence the reliability of these techniques to varying degrees.
The accuracy of the VaR methodology is reviewed by backtesting (i.e.,
comparing actual results against expectations derived from historical data)
the VaR results against the daily profit and loss. Graphic representation of the
backtesting results with additional explanation of backtesting excesses are
reported to the GRC. Backtesting excesses occur when trading losses exceed
VaR. Senior management reviews and evaluates the results of these tests. In
periods of market stress, the GRC members communicate daily to discuss
losses and VaR limit excesses. As a result of this process, the lines of
business may selectively reduce risk. Where economically feasible, positions
are sold or macroeconomic hedges are executed to reduce the exposure.
Bank of America 2010 105