Bank of America 2010 Annual Report Download - page 172
Download and view the complete annual report
Please find page 172 of the 2010 Bank of America annual report below. You can navigate through the pages in the report by either clicking on the pages listed below, or by using the keyword search tool below to find specific information within the annual report.-
 1
1 -
2
-
3
-
4
-
5
-
6
-
7
-
8
-
9
-
10
-
11
-
12
-
13
-
14
-
15
-
16
-
17
-
18
-
19
-
20
-
21
-
22
-
23
-
24
-
25
-
26
-
27
-
28
-
29
-
30
-
31
-
32
-
33
-
34
-
35
-
36
-
37
-
38
-
39
-
40
-
41
-
42
-
43
-
44
-
45
-
46
-
47
-
48
-
49
-
50
-
51
-
52
-
53
-
54
-
55
-
56
-
57
-
58
-
59
-
60
-
61
-
62
-
63
-
64
-
65
-
66
-
67
-
68
-
69
-
70
-
71
-
72
-
73
-
74
-
75
-
76
-
77
-
78
-
79
-
80
-
81
-
82
-
83
-
84
-
85
-
86
-
87
-
88
-
89
-
90
-
91
-
92
-
93
-
94
-
95
-
96
-
97
-
98
-
99
-
100
-
101
-
102
-
103
-
104
-
105
-
106
-
107
-
108
-
109
-
110
-
111
-
112
-
113
-
114
-
115
-
116
-
117
-
118
-
119
-
120
-
121
-
122
-
123
-
124
-
125
-
126
-
127
-
128
-
129
-
130
-
131
-
132
-
133
-
134
-
135
-
136
-
137
-
138
-
139
-
140
-
141
-
142
-
143
-
144
-
145
-
146
-
147
-
148
-
149
-
150
-
151
-
152
-
153
-
154
-
155
-
156
-
157
-
158
-
159
-
160
-
161
-
 162
162 -
 163
163 -
 164
164 -
 165
165 -
 166
166 -
 167
167 -
 168
168 -
 169
169 -
 170
170 -
 171
171 -
 172
172 -
 173
173 -
 174
174 -
 175
175 -
 176
176 -
 177
177 -
 178
178 -
 179
179 -
 180
180 -
 181
181 -
 182
182 -
183
-
184
-
185
-
186
-
187
-
188
-
189
-
190
-
191
-
192
-
193
-
194
-
195
-
196
-
197
-
198
-
199
-
200
-
201
-
202
-
203
-
204
-
205
-
206
-
207
-
208
-
209
-
210
-
211
-
212
-
213
-
214
-
215
-
216
-
217
-
218
-
219
-
220
-
221
-
222
-
223
-
224
-
225
-
226
-
227
-
228
-
229
-
230
-
231
-
232
-
233
-
234
-
235
-
236
-
237
-
238
-
239
-
240
-
241
-
242
-
243
-
244
-
245
-
246
-
247
-
248
-
249
-
250
-
251
-
252
 |
 |

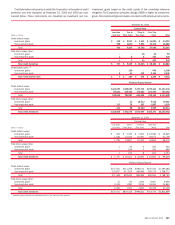
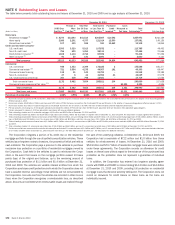
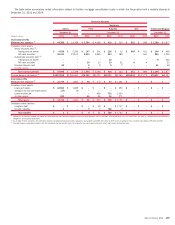
NOTE 6 Outstanding Loans and Leases
The table below presents total outstanding loans and leases at December 31, 2010 and 2009 and an age analysis at December 31, 2010.
(Dollars in millions)
30-89 Days
Past Due
(1)
90 Days or
More
Past Due
(2)
Total Past
Due 30 Days
or More
Total Current
or Less Than 30
Days Past Due
(3)
Purchased
Credit -
Impaired
(4)
Loans
Measured at
Fair Value
Total
Outstandings
(5)
Total
Outstandings
December 31, 2010
December 31, 2009
Home loans
Residential mortgage
(6)
$ 8,274 $33,240 $41,514 $205,867 $10,592 $257,973
$242,129
Home equity
2,086 2,291 4,377 121,014 12,590 137,981
149,126
Discontinued real estate
(7)
107 419 526 930 11,652 13,108
14,854
Credit card and other consumer
U.S. credit card
2,593 3,320 5,913 107,872 – 113,785
49,453
Non-U.S. credit card
755 599 1,354 26,111 – 27,465
21,656
Direct/Indirect consumer
(8)
1,608 1,104 2,712 87,596 – 90,308
97,236
Other consumer
(9)
90 50 140 2,690 – 2,830
3,110
Total consumer
15,513 41,023 56,536 552,080 34,834 643,450
577,564
Commercial
U.S. commercial
946 1,453 2,399 173,185 2 175,586
181,377
Commercial real estate
(10)
721 3,554 4,275 44,957 161 49,393
69,447
Commercial lease financing
118 31 149 21,793 – 21,942
22,199
Non-U.S. commercial
27 6 33 31,955 41 32,029
27,079
U.S. small business commercial
360 438 798 13,921 – 14,719
17,526
Total commercial loans
2,172 5,482 7,654 285,811 204 293,669
317,628
Commercial loans measured at fair value
(11)
– – – – – $3,321 3,321
4,936
Total commercial
2,172 5,482 7,654 285,811 204 3,321 296,990
322,564
Total loans and leases
$17,685 $46,505 $64,190 $837,891 $35,038 $3,321 $940,440
$900,128
Percentage of outstandings
1.88% 4.95% 6.83% 89.10% 3.72% 0.35%
(1)
Home loans includes $2.3 billion of FHA insured loans, $818 million of nonperforming loans and $156 million of TDRs that were removed from the Countrywide PCI loan portfolio prior to the adoption of new accounting guidance
effective January 1, 2010.
(2)
Home loans includes $16.8 billion of FHA insured loans and $372 million of TDRs that were removed from the Countrywide PCI loan portfolio prior to the adoption of new accounting guidance effective January 1, 2010.
(3)
Home loans includes $1.1 billion of nonperforming loans as all principal and interest are not current or are TDRs that have not demonstrated sustained repayment performance.
(4)
PCI loan amounts are shown gross of the valuation allowance and exclude $1.6 billion of PCI home loans from the Merrill Lynch acquisition which are included in their appropriate aging categories.
(5)
Periods subsequent to January 1, 2010 are presented in accordance with new consolidation guidance.
(6)
Total outstandings include non-U.S. residential mortgages of $90 million and $552 million at December 31, 2010 and 2009.
(7)
Total outstandings include $11.8 billion and $13.4 billion of pay option loans and $1.3 billion and $1.5 billion of subprime loans at December 31, 2010 and 2009. The Corporation no longer originates these products.
(8)
Total outstandings include dealer financial services loans of $42.9 billion and $41.6 billion, consumer lending of $12.9 billion and $19.7 billion, U.S. securities-based lending margin loans of $16.6 billion and $12.9 billion, student
loans of $6.8 billion and $10.8 billion, non-U.S. consumer loans of $8.0 billion and $8.0 billion, and other consumer loans of $3.1 billion and $4.2 billion at December 31, 2010 and 2009.
(9)
Total outstandings include consumer finance loans of $1.9 billion and $2.3 billion, other non-U.S. consumer loans of $803 million and $709 million, and consumer overdrafts of $88 million and $144 million at December 31, 2010
and 2009.
(10)
Total outstandings include U.S. commercial real estate loans of $46.9 billion and $66.5 billion, and non-U.S. commercial real estate loans of $2.5 billion and $3.0 billion at December 31, 2010 and 2009.
(11)
Certain commercial loans are accounted for under the fair value option and include U.S. commercial loans of $1.6 billion and $3.0 billion, non-U.S. commercial loans of $1.7 billion and $1.9 billion, and commercial real estate loans
of $79 million and $90 million at December 31, 2010 and 2009. See Note 22 – Fair Value Measurements and Note 23 – Fair Value Option for additional information.
The Corporation mitigates a portion of its credit risk on the residential
mortgage portfolio through the use of synthetic securitization vehicles. These
vehicles issue long-term notes to investors, the proceeds of which are held as
cash collateral. The Corporation pays a premium to the vehicles to purchase
mezzanine loss protection on a portfolio of residential mortgages owned by
the Corporation. Cash held in the vehicles is used to reimburse the Corpo-
ration in the event that losses on the mortgage portfolio exceed 10 basis
points (bps) of the original pool balance, up to the remaining amount of
purchased loss protection of $1.1 billion and $1.4 billion at December 31,
2010 and 2009. The vehicles are variable interest entities from which the
Corporation purchases credit protection and in which the Corporation does not
have a variable interest; accordingly, these vehicles are not consolidated by
the Corporation. Amounts due from the vehicles are recorded in other income
(loss) when the Corporation recognizes a reimbursable loss, as described
above. Amounts are collected when reimbursable losses are realized through
the sale of the underlying collateral. At December 31, 2010 and 2009, the
Corporation had a receivable of $722 million and $1.0 billion from these
vehicles for reimbursement of losses. At December 31, 2010 and 2009,
$53.9 billion and $70.7 billion of residential mortgage loans were referenced
under these agreements. The Corporation records an allowance for credit
losses on these loans without regard to the existence of the purchased loss
protection as the protection does not represent a guarantee of individual
loans.
In addition, the Corporation has entered into long-term standby agree-
ments with FNMA and FHLMC on loans totaling $14.3 billion and $6.6 billion
at December 31, 2010 and 2009, providing full protection on residential
mortgage loans that become severely delinquent. The Corporation does not
record an allowance for credit losses on these loans as the loans are
individually insured.
170 Bank of America 2010