Bank of America 2010 Annual Report Download - page 116
Download and view the complete annual report
Please find page 116 of the 2010 Bank of America annual report below. You can navigate through the pages in the report by either clicking on the pages listed below, or by using the keyword search tool below to find specific information within the annual report.-
 1
1 -
2
-
3
-
4
-
5
-
6
-
7
-
8
-
9
-
10
-
11
-
12
-
13
-
14
-
15
-
16
-
17
-
18
-
19
-
20
-
21
-
22
-
23
-
24
-
25
-
26
-
27
-
28
-
29
-
30
-
31
-
32
-
33
-
34
-
35
-
36
-
37
-
38
-
39
-
40
-
41
-
42
-
43
-
44
-
45
-
46
-
47
-
48
-
49
-
50
-
51
-
52
-
53
-
54
-
55
-
56
-
57
-
58
-
59
-
60
-
61
-
62
-
63
-
64
-
65
-
66
-
67
-
68
-
69
-
70
-
71
-
72
-
73
-
74
-
75
-
76
-
77
-
78
-
79
-
80
-
81
-
82
-
83
-
84
-
85
-
86
-
87
-
88
-
89
-
90
-
91
-
92
-
93
-
94
-
95
-
96
-
97
-
98
-
99
-
100
-
101
-
102
-
103
-
104
-
105
-
 106
106 -
 107
107 -
 108
108 -
 109
109 -
 110
110 -
 111
111 -
 112
112 -
 113
113 -
 114
114 -
 115
115 -
 116
116 -
 117
117 -
 118
118 -
 119
119 -
 120
120 -
 121
121 -
 122
122 -
 123
123 -
 124
124 -
 125
125 -
 126
126 -
127
-
128
-
129
-
130
-
131
-
132
-
133
-
134
-
135
-
136
-
137
-
138
-
139
-
140
-
141
-
142
-
143
-
144
-
145
-
146
-
147
-
148
-
149
-
150
-
151
-
152
-
153
-
154
-
155
-
156
-
157
-
158
-
159
-
160
-
161
-
162
-
163
-
164
-
165
-
166
-
167
-
168
-
169
-
170
-
171
-
172
-
173
-
174
-
175
-
176
-
177
-
178
-
179
-
180
-
181
-
182
-
183
-
184
-
185
-
186
-
187
-
188
-
189
-
190
-
191
-
192
-
193
-
194
-
195
-
196
-
197
-
198
-
199
-
200
-
201
-
202
-
203
-
204
-
205
-
206
-
207
-
208
-
209
-
210
-
211
-
212
-
213
-
214
-
215
-
216
-
217
-
218
-
219
-
220
-
221
-
222
-
223
-
224
-
225
-
226
-
227
-
228
-
229
-
230
-
231
-
232
-
233
-
234
-
235
-
236
-
237
-
238
-
239
-
240
-
241
-
242
-
243
-
244
-
245
-
246
-
247
-
248
-
249
-
250
-
251
-
252
 |
 |
are carried at fair value with changes in fair value reported in equity invest-
ment income. Initially the transaction price of the investment is generally
considered to be the best indicator of fair value. Thereafter, valuation of direct
investments is based on an assessment of each individual investment using
methodologies that include publicly traded comparables derived by multiplying
a key performance metric (e.g., earnings before interest, taxes, depreciation
and amortization) of the portfolio company by the relevant valuation multiple
observed for comparable companies, acquisition comparables, entry-level
multiples and discounted cash flows, and are subject to appropriate dis-
counts for lack of liquidity or marketability. Certain factors that may influence
changes in fair value include but are not limited to, recapitalizations, subse-
quent rounds of financing and offerings in the equity or debt capital markets.
For fund investments, we generally record the fair value of our proportionate
interest in the fund’s capital as reported by the fund’s respective managers.
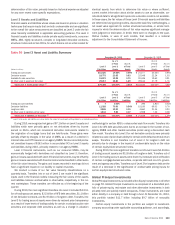
Accrued Income Taxes
Accrued income taxes, reported as a component of accrued expenses and
other liabilities on our Consolidated Balance Sheet, represents the net
amount of current income taxes we expect to pay to or receive from various
taxing jurisdictions attributable to our operations to date. We currently file
income tax returns in more than 100 jurisdictions and consider many factors,
including statutory, judicial and regulatory guidance,in estimating the appro-
priate accrued income taxes for each jurisdiction.
In applying the applicable accounting guidance, we monitor relevant tax
authorities and change our estimate of accrued income taxes due to changes in
income tax laws and their interpretation by the courts and regulatory authorities.
These revisions of our estimate of accrued income taxes, which also may result
from our income tax planning and from the resolution of income tax controver-
sies, may be material to our operating results for any given period.
Goodwill and Intangible Assets
Background
The nature of and accounting for goodwill and intangible assets are discussed
in Note 1 – Summary of Significant Accounting Principles and Note 10 –
Goodwill and Intangible Assets to the Consolidated Financial Statements.
Goodwill is reviewed for potential impairment at the reporting unit level on an
annual basis, which for the Corporation is performed as of June 30 and in
interim periods if events or circumstances indicate a potential impairment.
See discussion about the annual impairment test as of June 30, 2010 on
page 115. A reporting unit is a business segment or one level below. As
reporting units are determined after an acquisition or evolve with changes in
business strategy, goodwill is assigned to reporting units and it no longer
retains its association with a particular acquisition. All of the revenue streams
and related activities of a reporting unit, whether acquired or organic, are
available to support the value of the goodwill.
The Corporation’s common stock price, consistent with common stock
prices in the financial services industry, remains volatile primarily due to the
continued uncertainty in the financial markets as well as recent financial
reforms including the Financial Reform Act. Our market capitalization has
remained below our recorded book value during 2010. The fair value of all
reporting units in aggregate as of the June 30, 2010 annual impairment test
was estimated to be $264.4 billion and the common stock market capital-
ization of the Corporation as of that date was $144.2 billion ($134.5 billion at
December 31, 2010). The implied control premium, which is the amount a
buyer would be willing to pay over the current market price of a publicly traded
stock to obtain control, was 63 percent after taking into consideration the
outstanding preferred stock of $18.0 billion as of June 30, 2010. As none of
our reporting units are publicly traded, individual reporting unit fair value
determinations are not directly correlated to the Corporation’s stock price.
Although we believe it is reasonable to conclude that market capitalization
could be an indicator of fair value over time, we do not believe that recent
fluctuations in our market capitalization as a result of the current economic
conditions are reflective of actual cash flows and the fair value of our
individual reporting units.
Estimating the fair value of reporting units and the assets, liabilities and
intangible assets of a reporting unit is a subjective process that involves the
use of estimates and judgments, particularly related to cash flows, the
appropriate discount rates and an applicable control premium. The fair values
of the reporting units were determined using a combination of valuation
techniques consistent with the market approach and the income approach
and included the use of independent valuation specialists. Measurement of
the fair values of the assets, liabilities and intangibles of a reporting unit was
consistent with the requirements of the fair value measurements accounting
guidance and includes the use of estimates and judgments. The fair values of
the intangible assets were determined using the income approach.
The market approach we used estimates the fair value of the individual
reporting units by incorporating any combination of the tangible capital, book
capital and earnings multiples from comparable publicly traded companies in
industries similar to that of the reporting unit. The relative weight assigned to
these multiples varies among the reporting units based upon qualitative and
quantitative characteristics, primarily the size and relative profitability of the
respective reporting unit compared to the comparable publicly traded com-
panies. Since the fair values determined under the market approach are
representative of a noncontrolling interest, a control premium was added to
arrive at the reporting units’ estimated fair values on a controlling basis.
For purposes of the income approach, we calculated discounted cash flows
using estimated future cash flows and an appropriate terminal value. Our
discounted cash flow analysis employs a capital asset pricing model in esti-
mating the discount rate (i.e., cost of equity financing) for each reporting unit.
The inputs to this model include the risk-free rate of return, beta, which is a
measure of the level of non-diversifiable risk associated with comparable
companies for each specific reporting unit, market equity risk premium and
in certain cases an unsystematic (company-specific) risk factor. The unsys-
tematic risk factor is the input that specifically addresses uncertainty related to
our projections of earnings and growth, including the uncertainty related to loss
expectations. We utilized discount rates that we believe adequately reflect the
risk and uncertainty in the financial markets generally and specifically in our
internally developed forecasts. Expected rates of equity returns were estimated
based on historical market returns and risk/return rates for similar industries
of the reporting unit. We use our internal forecasts to estimate future cash
flows and actual results may differ from forecasted results.
Global Card Services Impairment
On July 21, 2010, the Financial Reform Act was signed into law. Under the
Financial Reform Act and its amendment to the Electronic Fund Transfer Act,
the Federal Reserve must adopt rules within nine months of enactment of the
Financial Reform Act regarding the interchange fees that may be charged with
respect to electronic debit transactions. Those rules will take effect one year
after enactment of the Financial Reform Act. The Financial Reform Act and the
applicable rules are expected to materially reduce the future revenues gen-
erated by the debit card business of the Corporation.
Our consumer and small business card products, including the debit card
business, are part of an integrated platform within Global Card Services.
During the three months ended September 30, 2010, our estimate of revenue
loss due to the debit card interchange fee standards to be adopted under the
Financial Reform Act was approximately $2.0 billion annually based on current
volumes. Accordingly, we performed an impairment test for Global Card
Services during the three months ended September 30, 2010. In step one
of the impairment test, the fair value of Global Card Services was estimated
under the income approach where the significant assumptions included the
114 Bank of America 2010