Bank of America 2010 Annual Report Download - page 85
Download and view the complete annual report
Please find page 85 of the 2010 Bank of America annual report below. You can navigate through the pages in the report by either clicking on the pages listed below, or by using the keyword search tool below to find specific information within the annual report.-
 1
1 -
2
-
3
-
4
-
5
-
6
-
7
-
8
-
9
-
10
-
11
-
12
-
13
-
14
-
15
-
16
-
17
-
18
-
19
-
20
-
21
-
22
-
23
-
24
-
25
-
26
-
27
-
28
-
29
-
30
-
31
-
32
-
33
-
34
-
35
-
36
-
37
-
38
-
39
-
40
-
41
-
42
-
43
-
44
-
45
-
46
-
47
-
48
-
49
-
50
-
51
-
52
-
53
-
54
-
55
-
56
-
57
-
58
-
59
-
60
-
61
-
62
-
63
-
64
-
65
-
66
-
67
-
68
-
69
-
70
-
71
-
72
-
73
-
74
-
 75
75 -
 76
76 -
 77
77 -
 78
78 -
 79
79 -
 80
80 -
 81
81 -
 82
82 -
 83
83 -
 84
84 -
 85
85 -
 86
86 -
 87
87 -
 88
88 -
 89
89 -
 90
90 -
 91
91 -
 92
92 -
 93
93 -
 94
94 -
 95
95 -
96
-
97
-
98
-
99
-
100
-
101
-
102
-
103
-
104
-
105
-
106
-
107
-
108
-
109
-
110
-
111
-
112
-
113
-
114
-
115
-
116
-
117
-
118
-
119
-
120
-
121
-
122
-
123
-
124
-
125
-
126
-
127
-
128
-
129
-
130
-
131
-
132
-
133
-
134
-
135
-
136
-
137
-
138
-
139
-
140
-
141
-
142
-
143
-
144
-
145
-
146
-
147
-
148
-
149
-
150
-
151
-
152
-
153
-
154
-
155
-
156
-
157
-
158
-
159
-
160
-
161
-
162
-
163
-
164
-
165
-
166
-
167
-
168
-
169
-
170
-
171
-
172
-
173
-
174
-
175
-
176
-
177
-
178
-
179
-
180
-
181
-
182
-
183
-
184
-
185
-
186
-
187
-
188
-
189
-
190
-
191
-
192
-
193
-
194
-
195
-
196
-
197
-
198
-
199
-
200
-
201
-
202
-
203
-
204
-
205
-
206
-
207
-
208
-
209
-
210
-
211
-
212
-
213
-
214
-
215
-
216
-
217
-
218
-
219
-
220
-
221
-
222
-
223
-
224
-
225
-
226
-
227
-
228
-
229
-
230
-
231
-
232
-
233
-
234
-
235
-
236
-
237
-
238
-
239
-
240
-
241
-
242
-
243
-
244
-
245
-
246
-
247
-
248
-
249
-
250
-
251
-
252
 |
 |

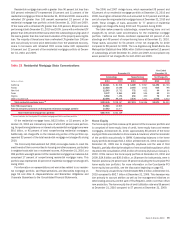
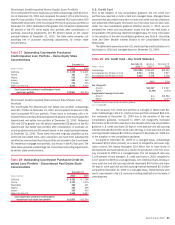
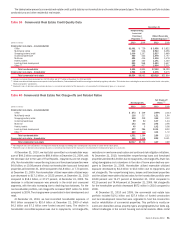
Purchased Credit-impaired Home Equity Loan Portfolio
The Countrywide PCI home equity loan portfolio outstandings were $12.6 bil-
lion at December 31, 2010 and comprised 36 percent of the total Country-
wide PCI loan portfolio. Those loans with a refreshed FICO score below 620
represented 26 percent of the Countrywide PCI home equity loan portfolio at
December 31, 2010. Refreshed CLTVs greater than 90 percent represented
85 percent of the PCI home equity loan portfolio after consideration of
purchase accounting adjustments and 85 percent based on the unpaid
principal balance at December 31, 2010. The table below presents out-
standings net of purchase accounting adjustments, by certain state
concentrations.
Table 27 Outstanding Countrywide Purchased
Credit-impaired Loan Portfolio – Home Equity State
Concentrations
(Dollars in millions)
2010 2009
December 31
California
$4,178
$4,311
Florida
750
765
Virginia
532
550
Arizona
520
542
Colorado
375
416
Other U.S./Non-U.S.
6,235
6,630
Total Countrywide purchased credit-impaired home
equity loan portfolio
$12,590
$13,214
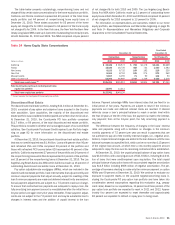
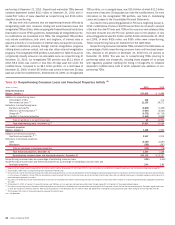
Purchased Credit-impaired Discontinued Real Estate Loan
Portfolio
The Countrywide PCI discontinued real estate loan portfolio outstandings
were $11.7 billion at December 31, 2010 and comprised 34 percent of the
total Countrywide PCI loan portfolio. Those loans to borrowers with a re-
freshed FICO score below 620 represented 62 percent of the Countrywide PCI
discontinued real estate loan portfolio at December 31, 2010. Refreshed
LTVs and CLTVs greater than 90 percent represented 55 percent of the PCI
discontinued real estate loan portfolio after consideration of purchase ac-
counting adjustments and 83 percent based on the unpaid principal balance
at December 31, 2010. Those loans that were originally classified as dis-
continued real estate loans upon acquisition and have been subsequently
modified are now excluded from this portfolio and included in the Countrywide
PCI residential mortgage loan portfolio, but remain in the PCI loan pool. The
table below presents outstandings net of purchase accounting adjustments,
by certain state concentrations.
Table 28 Outstanding Countrywide Purchased Credit-im-
paired Loan Portfolio – Discontinued Real Estate State
Concentrations
(Dollars in millions)
2010 2009
December 31
California
$6,322
$7,148
Florida
1,121
1,315
Washington
368
421
Virginia
344
399
Arizona
339
430
Other U.S./Non-U.S.
3,158
3,537
Total Countrywide purchased credit-impaired
discontinued real estate loan portfolio
$11,652
$13,250
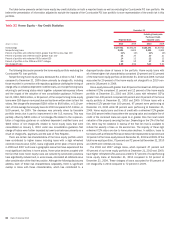
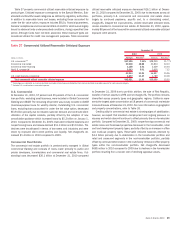
U.S. Credit Card
Prior to the adoption of new consolidation guidance, the U.S. credit card
portfolio was reported on both a held and managed basis. Managed basis
assumed that securitized loans were not sold into credit card securitizations
and presented credit quality information as if the loans had not been sold.
Under the new consolidation guidance effective January 1, 2010, we con-
solidated the credit card securitization trusts and the new held basis is
comparable to the previously reported managed basis. For more information
on the adoption of the new consolidation guidance, see Note 8 – Securitiza-
tions and Other Variable Interest Entities to the Consolidated Financial
Statements.
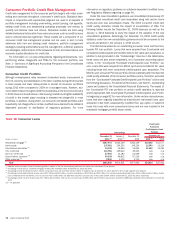
The table below presents certain U.S. credit card key credit statistics on a
held basis for 2010 and managed basis for December 31, 2009.
Table 29 U.S. Credit Card – Key Credit Statistics
(Dollars in millions)
December 31
2010
(1)
January 1
2010
(1)
December 31
2009
Outstandings
$113,785
$129,642 $49,453
Accruing past due 30 days or more
5,913
9,866 3,907
Accruing past due 90 days or more
3,320
5,408 2,158
2010 2009
Net charge-offs
Amount
$13,027
$6,547
Ratios
11.04%
12.50%
Supplemental managed basis data
Amount
n/a
$16,962
Ratios
n/a
12.07%
(1)
Balances reflect the impact of new consolidation guidance.
n/a = not applicable
The consumer U.S. credit card portfolio is managed in Global Card Ser-
vices. Outstandings in the U.S. credit card loan portfolio increased $64.3 bil-
lion compared to December 31, 2009 due to the adoption of the new
consolidation guidance. Compared to 2009, net charge-offs increased
$6.5 billion to $13.0 billion also due to the adoption of the new consolidation
guidance. U.S. credit card loans 30 days or more past due and still accruing
interest increased $2.0 billion while loans 90 days or more past due and still
accruing interest increased $1.2 billion compared to December 31, 2009 due
to the adoption of new consolidation guidance.
Compared to December 31, 2009 on a managed basis, outstandings
decreased $15.9 billion primarily as a result of charge-offs and lower origi-
nation volume. Net losses decreased $3.9 billion due to lower levels of
delinquencies and bankruptcies as a result of improvement in the U.S. econ-
omy compared to 2009 on a managed basis. The net charge-off ratio was
11.04 percent of total average U.S. credit card loans in 2010 compared to
12.07 percent in 2009 on a managed basis. U.S. credit card loans 30 days or
more past due and still accruing interest decreased $4.0 billion and loans
90 days or more past due and still accruing interest decreased $2.1 billion
compared to December 31, 2009 on a managed basis. These declines were
due to improvement in the U.S. economy including stabilization in the levels of
unemployment.
Bank of America 2010 83