Bank of America 2010 Annual Report Download - page 87
Download and view the complete annual report
Please find page 87 of the 2010 Bank of America annual report below. You can navigate through the pages in the report by either clicking on the pages listed below, or by using the keyword search tool below to find specific information within the annual report.-
 1
1 -
2
-
3
-
4
-
5
-
6
-
7
-
8
-
9
-
10
-
11
-
12
-
13
-
14
-
15
-
16
-
17
-
18
-
19
-
20
-
21
-
22
-
23
-
24
-
25
-
26
-
27
-
28
-
29
-
30
-
31
-
32
-
33
-
34
-
35
-
36
-
37
-
38
-
39
-
40
-
41
-
42
-
43
-
44
-
45
-
46
-
47
-
48
-
49
-
50
-
51
-
52
-
53
-
54
-
55
-
56
-
57
-
58
-
59
-
60
-
61
-
62
-
63
-
64
-
65
-
66
-
67
-
68
-
69
-
70
-
71
-
72
-
73
-
74
-
75
-
76
-
 77
77 -
 78
78 -
 79
79 -
 80
80 -
 81
81 -
 82
82 -
 83
83 -
 84
84 -
 85
85 -
 86
86 -
 87
87 -
 88
88 -
 89
89 -
 90
90 -
 91
91 -
 92
92 -
 93
93 -
 94
94 -
 95
95 -
 96
96 -
 97
97 -
98
-
99
-
100
-
101
-
102
-
103
-
104
-
105
-
106
-
107
-
108
-
109
-
110
-
111
-
112
-
113
-
114
-
115
-
116
-
117
-
118
-
119
-
120
-
121
-
122
-
123
-
124
-
125
-
126
-
127
-
128
-
129
-
130
-
131
-
132
-
133
-
134
-
135
-
136
-
137
-
138
-
139
-
140
-
141
-
142
-
143
-
144
-
145
-
146
-
147
-
148
-
149
-
150
-
151
-
152
-
153
-
154
-
155
-
156
-
157
-
158
-
159
-
160
-
161
-
162
-
163
-
164
-
165
-
166
-
167
-
168
-
169
-
170
-
171
-
172
-
173
-
174
-
175
-
176
-
177
-
178
-
179
-
180
-
181
-
182
-
183
-
184
-
185
-
186
-
187
-
188
-
189
-
190
-
191
-
192
-
193
-
194
-
195
-
196
-
197
-
198
-
199
-
200
-
201
-
202
-
203
-
204
-
205
-
206
-
207
-
208
-
209
-
210
-
211
-
212
-
213
-
214
-
215
-
216
-
217
-
218
-
219
-
220
-
221
-
222
-
223
-
224
-
225
-
226
-
227
-
228
-
229
-
230
-
231
-
232
-
233
-
234
-
235
-
236
-
237
-
238
-
239
-
240
-
241
-
242
-
243
-
244
-
245
-
246
-
247
-
248
-
249
-
250
-
251
-
252
 |
 |

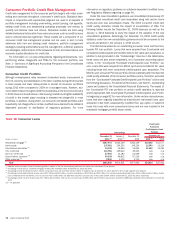
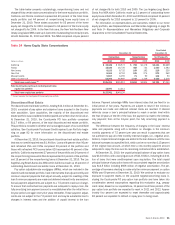
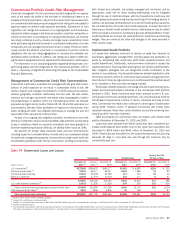
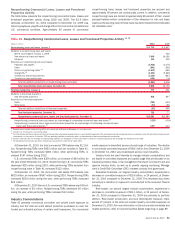
The table below presents certain state concentrations for the direct/indirect consumer loan portfolio.
Table 32 Direct/Indirect State Concentrations
(Dollars in millions)
2010 2009 2010 2009 2010 2009
Outstandings
Accruing Past Due
90 Days or More Net Charge-offs
December 31
Year Ended
December 31
California
$10,558
$11,664
$132
$228
$591
$1,055
Texas
7,885
8,743
78
105
262
382
Florida
6,725
7,559
80
130
343
597
New York
4,770
5,111
56
73
183
272
Georgia
2,814
3,165
44
52
126
205
Other U.S./Non-U.S.
57,556
60,994
668
900
1,831
2,952
Total direct/indirect loans
$90,308
$97,236
$1,058
$1,488
$3,336
$5,463
Other Consumer
At December 31, 2010, approximately 69 percent of the $2.8 billion other
consumer portfolio was associated with portfolios from certain consumer
finance businesses that we previously exited and is included in All Other.The
remainder consisted of the non-U.S. consumer loan portfolio, of which the
vast majority we previously exited and is largely in Global Card Services and
deposit overdrafts which are recorded in Deposits.
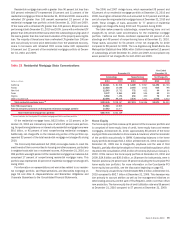
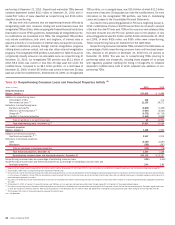
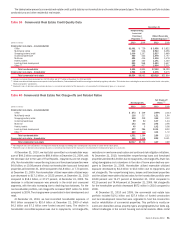
Nonperforming Consumer Loans and Foreclosed Properties
Activity
Table 33 presents nonperforming consumer loans and foreclosed properties
activity during 2010 and 2009. Nonperforming LHFS are excluded from
nonperforming loans as they are recorded at either fair value or the lower
of cost or fair value. Nonperforming loans do not include past due consumer
credit card loans and in general, past due consumer loans not secured by real
estate as these loans are generally charged off no later than the end of the
month in which the loan becomes 180 days past due. Real estate-secured
past due consumer loans insured by the FHA are not reported as nonperform-
ing as principal repayment is insured by the FHA. Additionally, nonperforming
loans do not include the Countrywide PCI loan portfolio. For further informa-
tion regarding nonperforming loans, see Note 1 – Summary of Significant
Accounting Principles to the Consolidated Financial Statements. Nonperform-
ing loans remained relatively flat at $20.9 billion at December 31, 2010
compared to $20.8 billion at December 31, 2009 as delinquency inflows to
nonaccrual loans slowed driven by favorable portfolio trends due in part to the
improving U.S. economy. These inflows were offset by charge-offs, nonper-
forming loans returning to performing status, and paydowns and payoffs.
The outstanding balance of a real estate-secured loan that is in excess of
the estimated property value, after reducing the property value for costs to
sell, is charged off no later than the end of the month in which the account
becomes 180 days past due unless repayment of the loan is insured by the
FHA. At December 31, 2010, $15.1 billion, or 69 percent, of the nonperform-
ing consumer real estate loans and foreclosed properties had been written
down to their fair values. This was comprised of $13.9 billion of nonperform-
ing loans 180 days or more past due and $1.2 billion of foreclosed properties.
Foreclosed properties decreased $179 million in 2010. PCI loans are
excluded from nonperforming loans as these loans were written down to fair
value at the acquisition date. However, once the underlying real estate is
acquired by the Corporation upon foreclosure of the delinquent PCI loan, it is
included in foreclosed properties. Net changes to foreclosed properties
related to PCI loans were an increase of $100 million in 2010. Not included
in foreclosed properties at December 31, 2010 was $1.4 billion of real estate
that was acquired by the Corporation upon foreclosure of delinquent FHA
insured loans. We hold this real estate on our balance sheet until we convey
these properties to the FHA. We exclude these amounts from our nonperform-
ing loans and foreclosed properties activity as we will be reimbursed once the
property is conveyed to the FHA for principal and up to certain limits, costs
incurred during the foreclosure process and interest incurred during the
holding period.
Restructured Loans
Nonperforming loans also include certain loans that have been modified in
TDRs where economic concessions have been granted to borrowers experi-
encing financial difficulties. These concessions typically result from the
Corporation’s loss mitigation activities and could include reductions in the
interest rate, payment extensions, forgiveness of principal, forbearance or
other actions. Certain TDRs are classified as nonperforming at the time of
restructuring and may only be returned to performing status after considering
the borrower’s sustained repayment performance under revised payment
terms for a reasonable period, generally six months. Nonperforming TDRs,
excluding those modified loans in the Countrywide PCI loan portfolio, are
included in Table 33.
Residential mortgage TDRs totaled $11.8 billion at December 31, 2010,
an increase of $4.6 billion compared to December 31, 2009. Of these loans,
$3.3 billion were nonperforming representing an increase of $130 million in
2010, and $8.5 billion were performing representing an increase of $4.5 bil-
lion in 2010 driven by TDRs returning to performing status and new additions.
These performing TDRs are excluded from nonperforming loans in Table 33.
Residential mortgage TDRs deemed collateral dependent totaled $3.2 billion
at December 31, 2010 and included $921 million of loans classified as
nonperforming and $2.3 billion classified as performing. At December 31,
2010, performing residential mortgage TDRs included $2.5 billion that were
FHA insured.
Home equity TDRs totaled $1.7 billion at December 31, 2010, a decrease
of $673 million compared to December 31, 2009. Of these loans, $541 mil-
lion were nonperforming representing a decrease of $1.2 billion in 2010
driven primarily by nonperforming TDRs returning to performing status and
charge-offs taken to comply with regulatory guidance clarifying the timing of
charge-offs on collateral dependent modified loans. Home equity TDRs that
were performing in accordance with their modified terms were $1.2 billion
representing an increase of $514 million in 2010. These performing TDRs are
excluded from nonperforming loans in Table 33. Home equity TDRs deemed
collateral dependent totaled $796 million at December 31, 2010 and in-
cluded $245 million of loans classified as nonperforming and $551 million
classified as performing.
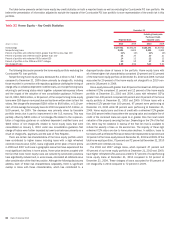
Discontinued real estate TDRs totaled $395 million at December 31,
2010, an increase of $13 million in 2010. Of these loans, $206 million were
nonperforming while the remaining $189 million were classified as
Bank of America 2010 85