Bank of America 2010 Annual Report Download - page 79
Download and view the complete annual report
Please find page 79 of the 2010 Bank of America annual report below. You can navigate through the pages in the report by either clicking on the pages listed below, or by using the keyword search tool below to find specific information within the annual report.-
 1
1 -
2
-
3
-
4
-
5
-
6
-
7
-
8
-
9
-
10
-
11
-
12
-
13
-
14
-
15
-
16
-
17
-
18
-
19
-
20
-
21
-
22
-
23
-
24
-
25
-
26
-
27
-
28
-
29
-
30
-
31
-
32
-
33
-
34
-
35
-
36
-
37
-
38
-
39
-
40
-
41
-
42
-
43
-
44
-
45
-
46
-
47
-
48
-
49
-
50
-
51
-
52
-
53
-
54
-
55
-
56
-
57
-
58
-
59
-
60
-
61
-
62
-
63
-
64
-
65
-
66
-
67
-
68
-
 69
69 -
 70
70 -
 71
71 -
 72
72 -
 73
73 -
 74
74 -
 75
75 -
 76
76 -
 77
77 -
 78
78 -
 79
79 -
 80
80 -
 81
81 -
 82
82 -
 83
83 -
 84
84 -
 85
85 -
 86
86 -
 87
87 -
 88
88 -
 89
89 -
90
-
91
-
92
-
93
-
94
-
95
-
96
-
97
-
98
-
99
-
100
-
101
-
102
-
103
-
104
-
105
-
106
-
107
-
108
-
109
-
110
-
111
-
112
-
113
-
114
-
115
-
116
-
117
-
118
-
119
-
120
-
121
-
122
-
123
-
124
-
125
-
126
-
127
-
128
-
129
-
130
-
131
-
132
-
133
-
134
-
135
-
136
-
137
-
138
-
139
-
140
-
141
-
142
-
143
-
144
-
145
-
146
-
147
-
148
-
149
-
150
-
151
-
152
-
153
-
154
-
155
-
156
-
157
-
158
-
159
-
160
-
161
-
162
-
163
-
164
-
165
-
166
-
167
-
168
-
169
-
170
-
171
-
172
-
173
-
174
-
175
-
176
-
177
-
178
-
179
-
180
-
181
-
182
-
183
-
184
-
185
-
186
-
187
-
188
-
189
-
190
-
191
-
192
-
193
-
194
-
195
-
196
-
197
-
198
-
199
-
200
-
201
-
202
-
203
-
204
-
205
-
206
-
207
-
208
-
209
-
210
-
211
-
212
-
213
-
214
-
215
-
216
-
217
-
218
-
219
-
220
-
221
-
222
-
223
-
224
-
225
-
226
-
227
-
228
-
229
-
230
-
231
-
232
-
233
-
234
-
235
-
236
-
237
-
238
-
239
-
240
-
241
-
242
-
243
-
244
-
245
-
246
-
247
-
248
-
249
-
250
-
251
-
252
 |
 |

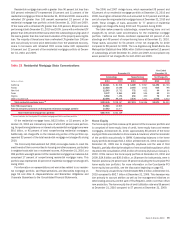
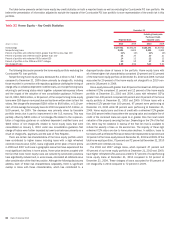
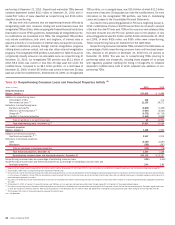
The table below presents our accruing consumer loans past due 90 days
or more and our consumer nonperforming loans. Nonperforming loans do not
include past due consumer credit card loans, consumer non-real estate-
secured loans or unsecured consumer loans as these loans are generally
charged off no later than the end of the month in which the loan becomes
180 days past due. Real estate-secured past due consumer loans insured by
the FHA are reported as accruing as opposed to nonperforming since the
principal repayment is insured by the FHA. FHA insured loans accruing past
due 90 days or more are primarily related to our purchases of delinquent loans
pursuant to our servicing agreements with GNMA. Additionally, nonperforming
loans and accruing balances past due 90 days or more do not include the
Countrywide PCI loans even though the customer may be contractually past
due.
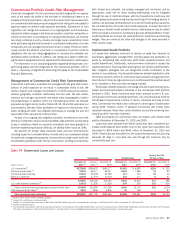
Table 19 Consumer Credit Quality
(Dollars in millions)
December 31
2010
(1)
January 1
2010
(1)
December 31
2009
December 31
2010
(1)
January 1
2010
(1)
December 31
2009
Accruing Past Due 90 Days or More Nonperforming
Residential mortgage
(2, 3)
$16,768
$11,680 $11,680
$17,691
$16,596 $16,596
Home equity
(2)
–
––
2,694
4,252 3,804
Discontinued real estate
(2)
–
––
331
249 249
U.S. credit card
3,320
5,408 2,158
n/a
n/a n/a
Non-U.S. credit card
599
814 515
n/a
n/a n/a
Direct/Indirect consumer
1,058
1,492 1,488
90
86 86
Other consumer
2
33
48
104 104
Total
$21,747
$19,397 $15,844
$20,854
$21,287 $20,839
(1)
Balances reflect the impact of new consolidation guidance.
(2)
Our policy is to classify consumer real estate-secured loans as nonperforming at 90 days past due, except Countrywide PCI loans and FHA loans as referenced in footnote (3).
(3)
At December 31, 2010 and 2009, balances accruing past due 90 daysor more represent loans insured by the FHA. Thesebalances include $8.3 billion and $2.2 billion of loans that are no longer accruing interest or interest has been
curtailed by the FHA although principal is still insured and $8.5 billion and $9.5 billion of loans that were still accruing interest. Our policy is to classify delinquent consumer loans secured by real estate and insured by the FHA as
accruing past due 90 days or more.
n/a = not applicable
Accruing consumer loans and leases past due 90 days or more as a
percentage of outstanding consumer loans and leases were 3.38 percent
(0.90 percent excluding the Countrywide PCI and FHA insured loan portfolios)
and 2.74 percent (0.79 percent excluding the Countrywide PCI and FHA
insured loan portfolios) at December 31, 2010 and 2009. Nonperforming
consumer loans as a percentage of outstanding consumer loans were
3.24 percent (3.76 percent excluding the Countrywide PCI and FHA insured
loan portfolios) and 3.61 percent (3.95 percent excluding the Countrywide PCI
and FHA insured loan portfolios) at December 31, 2010 and 2009.
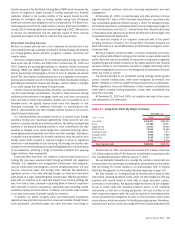
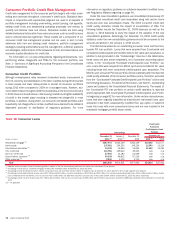
The table below presents net charge-offs and related ratios for our con-
sumer loans and leases for 2010 and 2009 (managed basis for 2009).
Table 20 Consumer Net Charge-offs, Net Losses and Related Ratios
(Dollars in millions)
2010 2009 2010 2009
Net Charge-offs Net Charge-offs
(1, 2)
Held basis
Residential mortgage
$3,670
$4,350
1.49%
1.74%
Home equity
6,781
7,050
4.65
4.56
Discontinued real estate
68
101
0.49
0.58
U.S. credit card
13,027
6,547
11.04
12.50
Non-U.S. credit card
2,207
1,239
7.88
6.30
Direct/Indirect consumer
3,336
5,463
3.45
5.46
Other consumer
261
428
8.89
12.94
Total held
$29,350
$25,178
4.51
4.22
Net Losses Net Losses
(1)
Supplemental managed basis data
U.S. credit card
n/a
$16,962
n/a
12.07
Non-U.S. credit card
n/a
2,223
n/a
7.43
Total credit card – managed
n/a
$19,185
n/a
11.25
(1)
Net charge-off and net loss ratios are calculated as held net charge-offs or managed net losses divided by average outstanding held or managed loans andleases.
(2)
Net charge-off ratios excluding the Countrywide PCI and FHA insured loan portfolio were 1.79 percent and 1.83 percent for residential mortgage, 5.10 percent and 5.00 percent for home equity, 4.20 percent and 5.57 percent for
discontinued real estate and 5.02 percent and 4.53 percent for the total held portfolio for 2010 and 2009. These are the only product classifications materially impacted by the Countrywide PCI loan portfolio for 2010 and 2009. For
all loan and lease categories, the net charge-offs were unchanged.
n/a = not applicable
We believe that the presentation of information adjusted to exclude the
impact of the Countrywide PCI and FHA insured loan portfolios is more
representative of the ongoing operations and credit quality of the business.
As a result, in the following discussions of the residential mortgage, home
equity and discontinued real estate portfolios, we provide information that is
adjusted to exclude the impact of the Countrywide PCI and FHA insured loan
portfolios. In addition, beginning on page 82, we separately disclose infor-
mation on the Countrywide PCI loan portfolio.
Bank of America 2010 77