Bank of America 2011 Annual Report Download - page 100
Download and view the complete annual report
Please find page 100 of the 2011 Bank of America annual report below. You can navigate through the pages in the report by either clicking on the pages listed below, or by using the keyword search tool below to find specific information within the annual report.-
 1
1 -
2
-
3
-
4
-
5
-
6
-
7
-
8
-
9
-
10
-
11
-
12
-
13
-
14
-
15
-
16
-
17
-
18
-
19
-
20
-
21
-
22
-
23
-
24
-
25
-
26
-
27
-
28
-
29
-
30
-
31
-
32
-
33
-
34
-
35
-
36
-
37
-
38
-
39
-
40
-
41
-
42
-
43
-
44
-
45
-
46
-
47
-
48
-
49
-
50
-
51
-
52
-
53
-
54
-
55
-
56
-
57
-
58
-
59
-
60
-
61
-
62
-
63
-
64
-
65
-
66
-
67
-
68
-
69
-
70
-
71
-
72
-
73
-
74
-
75
-
76
-
77
-
78
-
79
-
80
-
81
-
82
-
83
-
84
-
85
-
86
-
87
-
88
-
89
-
 90
90 -
 91
91 -
 92
92 -
 93
93 -
 94
94 -
 95
95 -
 96
96 -
 97
97 -
 98
98 -
 99
99 -
 100
100 -
 101
101 -
 102
102 -
 103
103 -
 104
104 -
 105
105 -
 106
106 -
 107
107 -
 108
108 -
 109
109 -
 110
110 -
111
-
112
-
113
-
114
-
115
-
116
-
117
-
118
-
119
-
120
-
121
-
122
-
123
-
124
-
125
-
126
-
127
-
128
-
129
-
130
-
131
-
132
-
133
-
134
-
135
-
136
-
137
-
138
-
139
-
140
-
141
-
142
-
143
-
144
-
145
-
146
-
147
-
148
-
149
-
150
-
151
-
152
-
153
-
154
-
155
-
156
-
157
-
158
-
159
-
160
-
161
-
162
-
163
-
164
-
165
-
166
-
167
-
168
-
169
-
170
-
171
-
172
-
173
-
174
-
175
-
176
-
177
-
178
-
179
-
180
-
181
-
182
-
183
-
184
-
185
-
186
-
187
-
188
-
189
-
190
-
191
-
192
-
193
-
194
-
195
-
196
-
197
-
198
-
199
-
200
-
201
-
202
-
203
-
204
-
205
-
206
-
207
-
208
-
209
-
210
-
211
-
212
-
213
-
214
-
215
-
216
-
217
-
218
-
219
-
220
-
221
-
222
-
223
-
224
-
225
-
226
-
227
-
228
-
229
-
230
-
231
-
232
-
233
-
234
-
235
-
236
-
237
-
238
-
239
-
240
-
241
-
242
-
243
-
244
-
245
-
246
-
247
-
248
-
249
-
250
-
251
-
252
-
253
-
254
-
255
-
256
-
257
-
258
-
259
-
260
-
261
-
262
-
263
-
264
-
265
-
266
-
267
-
268
-
269
-
270
-
271
-
272
-
273
-
274
-
275
-
276
 |
 |

98 Bank of America 2011
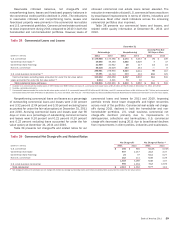
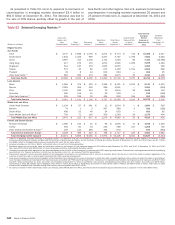
The credit risk amounts discussed above and presented in
Table 50 take into consideration the effects of legally enforceable
master netting agreements, while amounts disclosed in Note 4 –
Derivatives to the Consolidated Financial Statements are shown
on a gross basis. Credit risk reflects the potential benefit from
offsetting exposure to non-credit derivative products with the same
counterparties that may be netted upon the occurrence of certain
events, thereby reducing our overall exposure.
Table 50
(Dollars in millions)
Purchased credit derivatives:
Credit default swaps
Total return swaps/other
Total purchased credit derivatives
Written credit derivatives:
Credit default swaps
Total return swaps/other
Total written credit derivatives
Total credit derivatives
Credit Derivatives
December 31
2011
Contract/
Notional
$ 1,944,764
17,519
1,962,283
1,885,944
17,838
1,903,782
$ 3,866,065
Credit Risk
$ 14,163
776
14,939
n/a
n/a
n/a
$ 14,939
2010
Contract/
Notional
$ 2,184,703
26,038
2,210,741
2,133,488
22,474
2,155,962
$ 4,366,703
Credit Risk
$ 18,150
1,013
19,163
n/a
n/a
n/a
$ 19,163
n/a = not applicable
Counterparty Credit Risk Valuation Adjustments
We record a counterparty credit risk valuation adjustment on
certain derivative assets, including our credit default protection
purchased, in order to properly reflect the credit quality of the
counterparty. These adjustments are necessary as the market
quotes on derivatives do not fully reflect the credit risk of the
counterparties to the derivative assets. We consider collateral and
legally enforceable master netting agreements that mitigate our
credit exposure to each counterparty in determining the
counterparty credit risk valuation adjustment. All or a portion of
these counterparty credit risk valuation adjustments are
subsequently adjusted due to changes in the value of the derivative
contract, collateral and creditworthiness of the counterparty.
During 2011 and 2010, credit valuation gains (losses) of $(1.9)
billion and $731 million ($(606) million and $(8) million, net of
hedges) for counterparty credit risk were recognized in trading
account profits for counterparty credit risk related to derivative
assets. For information on our monoline counterparty credit risk,
see GBAM – Collateralized Debt Obligation and Monoline Exposure
on page 45 and Monoline and Related Exposure on page 95.
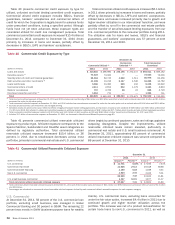
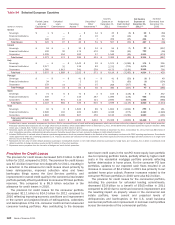
Non-U.S. Portfolio
Our non-U.S. credit and trading portfolios are subject to country
risk. We define country risk as the risk of loss from unfavorable
economic and political conditions, currency fluctuations, social
instability and changes in government policies. A risk management
framework is in place to measure, monitor and manage non-
U.S. risk and exposures. Management oversight of country risk,
including cross-border risk, is provided by the Regional Risk
Committee, a subcommittee of the CRC.
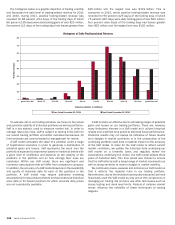
Table 51 sets forth total non-U.S. exposure broken out by region
at December 31, 2011 and 2010. Non-U.S. exposure includes
credit exposure net of local liabilities, securities and other
investments issued by or domiciled in countries other than the
U.S. Total non-U.S. exposure can be adjusted for externally
guaranteed loans outstanding and certain collateral types.
Exposures which are subject to external guarantees are reported
under the country of the guarantor. Exposures with tangible
collateral are reflected in the country where the collateral is held.
For securities received, other than cross-border resale
agreements, outstandings are assigned to the domicile of the
issuer of the securities. Resale agreements are generally
presented based on the domicile of the counterparty consistent
with FFIEC reporting requirements.
Table 51
(Dollars in millions)
Europe
Asia Pacific
Latin America
Middle East and Africa
Other
Total
Regional Non-U.S. Exposure (1, 2, 3)
December 31
2011
$ 115,914
74,577
17,415
4,614
20,101
$ 232,621
2010
$ 148,078
73,255
14,848
3,688
22,188
$ 262,057
(1) Local funding or liabilities are subtracted from local exposures consistent with FFIEC reporting
requirements.
(2) Derivative assets included in the exposure amounts have been reduced by the amount of cash
collateral applied of $45.6 billion and $44.2 billion at December 31, 2011 and 2010.
(3) Cross-border resale agreements where the underlying securities are U.S. Treasury securities,
in which case the domicile is the U.S., are excluded from this presentation.