Bank of America 2011 Annual Report Download - page 27
Download and view the complete annual report
Please find page 27 of the 2011 Bank of America annual report below. You can navigate through the pages in the report by either clicking on the pages listed below, or by using the keyword search tool below to find specific information within the annual report.-
 1
1 -
2
-
3
-
4
-
5
-
6
-
7
-
8
-
9
-
10
-
11
-
12
-
13
-
14
-
15
-
16
-
 17
17 -
 18
18 -
 19
19 -
 20
20 -
 21
21 -
 22
22 -
 23
23 -
 24
24 -
 25
25 -
 26
26 -
 27
27 -
 28
28 -
 29
29 -
 30
30 -
 31
31 -
 32
32 -
 33
33 -
 34
34 -
 35
35 -
 36
36 -
 37
37 -
38
-
39
-
40
-
41
-
42
-
43
-
44
-
45
-
46
-
47
-
48
-
49
-
50
-
51
-
52
-
53
-
54
-
55
-
56
-
57
-
58
-
59
-
60
-
61
-
62
-
63
-
64
-
65
-
66
-
67
-
68
-
69
-
70
-
71
-
72
-
73
-
74
-
75
-
76
-
77
-
78
-
79
-
80
-
81
-
82
-
83
-
84
-
85
-
86
-
87
-
88
-
89
-
90
-
91
-
92
-
93
-
94
-
95
-
96
-
97
-
98
-
99
-
100
-
101
-
102
-
103
-
104
-
105
-
106
-
107
-
108
-
109
-
110
-
111
-
112
-
113
-
114
-
115
-
116
-
117
-
118
-
119
-
120
-
121
-
122
-
123
-
124
-
125
-
126
-
127
-
128
-
129
-
130
-
131
-
132
-
133
-
134
-
135
-
136
-
137
-
138
-
139
-
140
-
141
-
142
-
143
-
144
-
145
-
146
-
147
-
148
-
149
-
150
-
151
-
152
-
153
-
154
-
155
-
156
-
157
-
158
-
159
-
160
-
161
-
162
-
163
-
164
-
165
-
166
-
167
-
168
-
169
-
170
-
171
-
172
-
173
-
174
-
175
-
176
-
177
-
178
-
179
-
180
-
181
-
182
-
183
-
184
-
185
-
186
-
187
-
188
-
189
-
190
-
191
-
192
-
193
-
194
-
195
-
196
-
197
-
198
-
199
-
200
-
201
-
202
-
203
-
204
-
205
-
206
-
207
-
208
-
209
-
210
-
211
-
212
-
213
-
214
-
215
-
216
-
217
-
218
-
219
-
220
-
221
-
222
-
223
-
224
-
225
-
226
-
227
-
228
-
229
-
230
-
231
-
232
-
233
-
234
-
235
-
236
-
237
-
238
-
239
-
240
-
241
-
242
-
243
-
244
-
245
-
246
-
247
-
248
-
249
-
250
-
251
-
252
-
253
-
254
-
255
-
256
-
257
-
258
-
259
-
260
-
261
-
262
-
263
-
264
-
265
-
266
-
267
-
268
-
269
-
270
-
271
-
272
-
273
-
274
-
275
-
276
 |
 |

Bank of America 2011 25
Performance Overview
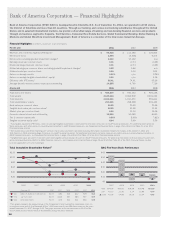
Net income was $1.4 billion in 2011 compared to a net loss of
$2.2 billion in 2010. After preferred stock dividends of $1.4 billion
in both 2011 and 2010, net income applicable to common
shareholders was $85 million, or $0.01 per diluted common share
in 2011 compared to a net loss of $3.6 billion, or $0.37 per diluted
common share in 2010. The principal contributors to the pre-tax
net income in 2011 were the following: gains of $6.5 billion on
the sale of CCB shares (we currently hold approximately one
percent of the outstanding common shares), a $7.4 billion
reduction in the allowance for credit losses, $3.4 billion of gains
on sales of debt securities, positive fair value adjustments of $3.3
billion related to our own credit spreads on structured liabilities,
a $1.2 billion gain on the exchange of certain trust preferred
securities for common stock and debt and DVA gains on derivatives
of $1.0 billion, net of hedges. These contributors were offset by
$15.6 billion in representations and warranties provision, litigation
expense of $5.6 billion, goodwill impairment charges of $3.2
billion, $1.8 billion of mortgage-related assessments and waivers
costs, and $1.1 billion of impairment charges on our merchant
services joint venture.
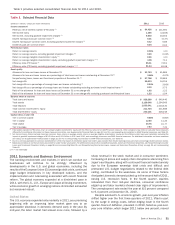
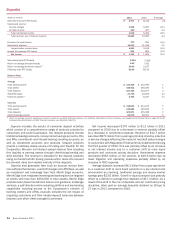
Table 2
(Dollars in millions)
Net interest income (FTE basis) (1)
Noninterest income
Total revenue, net of interest expense (FTE basis) (1)
Provision for credit losses
Goodwill impairment
All other noninterest expense
Income (loss) before income taxes
Income tax expense (benefit) (FTE basis) (1)
Net income (loss)
Preferred stock dividends
Net income (loss) applicable to common shareholders
Per common share information
Earnings (loss)
Diluted earnings (loss)
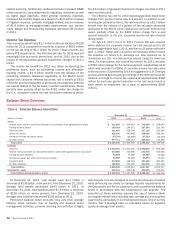
Summary Income Statement
2011
$ 45,588
48,838
94,426
13,410
3,184
77,090
742
(704)
1,446
1,361
$85
$ 0.01
0.01
2010
$ 52,693
58,697
111,390
28,435
12,400
70,708
(153)
2,085
(2,238)
1,357
$ (3,595)
$ (0.37)
(0.37)
(1) Fully taxable-equivalent (FTE) basis is a non-GAAP financial measure. Other companies may
define or calculate this measure differently. For more information on this measure, see
Supplemental Financial Data on page 32, and for a corresponding reconciliation to a GAAP
financial measure, see Table XV.
Net interest income on a FTE basis decreased $7.1 billion in
2011 to $45.6 billion. The decline was primarily due to lower
consumer loan balances and yields and decreased investment
security yields. Lower trading-related net interest income also
negatively impacted 2011 results. These decreases were partially
offset by ongoing reductions in our debt footprint and lower rates
paid on deposits. The net interest yield on a FTE basis was 2.48
percent for 2011 compared to 2.78 percent for 2010.
Noninterest income decreased $9.9 billion in 2011 to $48.8
billion. The most significant contributors to the decline were lower
mortgage banking income, down $11.6 billion largely due to higher
representations and warranties provision, and a decrease of $3.4
billion in trading account profits. These declines were partially
offset by the gains on the sale of CCB shares and higher positive
fair value adjustments related to our own credit on structured
liabilities in 2011. In addition, in connection with separate
agreements with certain trust preferred security holders to
exchange their holdings for common stock and senior notes, we
recorded gains of $1.2 billion in 2011. For additional information
on these exchange agreements, see Note 13 – Long-term Debt to
the Consolidated Financial Statements.
The provision for credit losses decreased $15.0 billion in 2011
to $13.4 billion. The provision for credit losses was $7.4 billion
lower than net charge-offs for 2011, resulting in a reduction in the
allowance for credit losses, as portfolio trends continued to
improve across most of the consumer and commercial businesses,
particularly the Card Services and commercial real estate
portfolios partially offset by additions to consumer purchased
credit-impaired (PCI) loan portfolio reserves. This compared to a
$5.9 billion reduction in the allowance for credit losses in 2010.
Noninterest expense decreased $2.8 billion in 2011 to $80.3
billion. The decline was driven by a $9.2 billion decrease in goodwill
impairment charges and a $1.2 billion decline in merger and
restructuring charges in 2011. Partially offsetting these decreases
was a $4.9 billion increase in other general operating expense
which included increases of $3.0 billion in litigation expense and
$1.6 billion in mortgage-related assessments and waivers costs,
and an increase of $1.8 billion in personnel costs due to the
continued build-out of certain businesses, technology costs as
well as increases in default-related servicing costs.
The income tax benefit on a FTE basis was $704 million on
the pre-tax income of $742 million for 2011 compared to income
tax expense on a FTE basis of $2.1 billion on the pre-tax loss of
$153 million for 2010. For more information, see Financial
Highlights – Income Tax Expense on page 28.