Bank of America 2011 Annual Report Download - page 78
Download and view the complete annual report
Please find page 78 of the 2011 Bank of America annual report below. You can navigate through the pages in the report by either clicking on the pages listed below, or by using the keyword search tool below to find specific information within the annual report.-
 1
1 -
2
-
3
-
4
-
5
-
6
-
7
-
8
-
9
-
10
-
11
-
12
-
13
-
14
-
15
-
16
-
17
-
18
-
19
-
20
-
21
-
22
-
23
-
24
-
25
-
26
-
27
-
28
-
29
-
30
-
31
-
32
-
33
-
34
-
35
-
36
-
37
-
38
-
39
-
40
-
41
-
42
-
43
-
44
-
45
-
46
-
47
-
48
-
49
-
50
-
51
-
52
-
53
-
54
-
55
-
56
-
57
-
58
-
59
-
60
-
61
-
62
-
63
-
64
-
65
-
66
-
67
-
 68
68 -
 69
69 -
 70
70 -
 71
71 -
 72
72 -
 73
73 -
 74
74 -
 75
75 -
 76
76 -
 77
77 -
 78
78 -
 79
79 -
 80
80 -
 81
81 -
 82
82 -
 83
83 -
 84
84 -
 85
85 -
 86
86 -
 87
87 -
 88
88 -
89
-
90
-
91
-
92
-
93
-
94
-
95
-
96
-
97
-
98
-
99
-
100
-
101
-
102
-
103
-
104
-
105
-
106
-
107
-
108
-
109
-
110
-
111
-
112
-
113
-
114
-
115
-
116
-
117
-
118
-
119
-
120
-
121
-
122
-
123
-
124
-
125
-
126
-
127
-
128
-
129
-
130
-
131
-
132
-
133
-
134
-
135
-
136
-
137
-
138
-
139
-
140
-
141
-
142
-
143
-
144
-
145
-
146
-
147
-
148
-
149
-
150
-
151
-
152
-
153
-
154
-
155
-
156
-
157
-
158
-
159
-
160
-
161
-
162
-
163
-
164
-
165
-
166
-
167
-
168
-
169
-
170
-
171
-
172
-
173
-
174
-
175
-
176
-
177
-
178
-
179
-
180
-
181
-
182
-
183
-
184
-
185
-
186
-
187
-
188
-
189
-
190
-
191
-
192
-
193
-
194
-
195
-
196
-
197
-
198
-
199
-
200
-
201
-
202
-
203
-
204
-
205
-
206
-
207
-
208
-
209
-
210
-
211
-
212
-
213
-
214
-
215
-
216
-
217
-
218
-
219
-
220
-
221
-
222
-
223
-
224
-
225
-
226
-
227
-
228
-
229
-
230
-
231
-
232
-
233
-
234
-
235
-
236
-
237
-
238
-
239
-
240
-
241
-
242
-
243
-
244
-
245
-
246
-
247
-
248
-
249
-
250
-
251
-
252
-
253
-
254
-
255
-
256
-
257
-
258
-
259
-
260
-
261
-
262
-
263
-
264
-
265
-
266
-
267
-
268
-
269
-
270
-
271
-
272
-
273
-
274
-
275
-
276
 |
 |

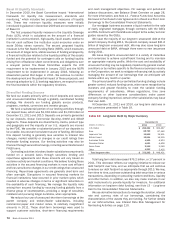
76 Bank of America 2011
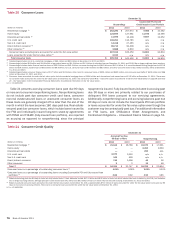
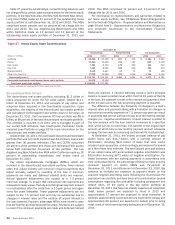
Table 20
(Dollars in millions)
Residential mortgage (1)
Home equity
Discontinued real estate (2)
U.S. credit card
Non-U.S. credit card
Direct/Indirect consumer (3)
Other consumer (4)
Consumer loans excluding loans accounted for under the fair value option
Loans accounted for under the fair value option (5)
Total consumer loans
Consumer Loans
December 31
Outstandings
2011
$ 262,290
124,699
11,095
102,291
14,418
89,713
2,688
607,194
2,190
$ 609,384
2010
$257,973
137,981
13,108
113,785
27,465
90,308
2,830
643,450
n/a
$643,450
Countrywide Purchased
Credit-impaired Loan Portfolio
2011
$ 9,966
11,978
9,857
n/a
n/a
n/a
n/a
31,801
n/a
$31,801
2010
$ 10,592
12,590
11,652
n/a
n/a
n/a
n/a
34,834
n/a
$ 34,834
(1) Outstandings includes non-U.S. residential mortgages of $85 million and $90 million at December 31, 2011 and 2010.
(2) Outstandings includes $9.9 billion and $11.8 billion of pay option loans and $1.2 billion and $1.3 billion of subprime loans at December 31, 2011 and 2010. We no longer originate these products.
(3) Outstandings includes dealer financial services loans of $43.0 billion and $43.3 billion, consumer lending loans of $8.0 billion and $12.4 billion, U.S. securities-based lending margin loans of $23.6
billion and $16.6 billion, student loans of $6.0 billion and $6.8 billion, non-U.S. consumer loans of $7.6 billion and $8.0 billion, and other consumer loans of $1.5 billion and $3.2 billion at December
31, 2011 and 2010.
(4) Outstandings includes consumer finance loans of $1.7 billion and $1.9 billion, other non-U.S. consumer loans of $929 million and $803 million, and consumer overdrafts of $103 million and $88
million at December 31, 2011 and 2010.
(5) Consumer loans accounted for under the fair value option include residential mortgage loans of $906 million and discontinued real estate loans of $1.3 billion at December 31, 2011. There were
no consumer loans accounted for under the fair value option at December 31, 2010. See Consumer Credit Risk – Consumer Loans Accounted for Under the Fair Value Option on page 86 and Note
23 – Fair Value Option to the Consolidated Financial Statements for additional information on the fair value option.
n/a = not applicable
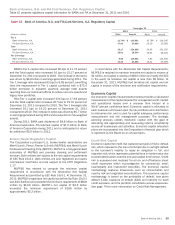
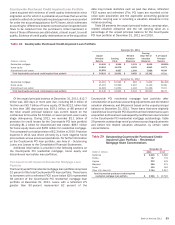
Table 21 presents accruing consumer loans past due 90 days
or more and consumer nonperforming loans. Nonperforming loans
do not include past due consumer credit card loans, consumer
non-real estate-secured loans or unsecured consumer loans as
these loans are generally charged off no later than the end of the
month in which the loan becomes 180 days past due. Real estate-
secured past due consumer loans, which include loans insured by
the FHA and individually insured long-term stand-by agreements
with FNMA and FHLMC (fully-insured loan portfolio), are reported
as accruing as opposed to nonperforming since the principal
repayment is insured. Fully-insured loans included in accruing past
due 90 days or more are primarily related to our purchases of
delinquent FHA loans pursuant to our servicing agreements.
Additionally, nonperforming loans and accruing balances past due
90 days or more do not include the Countrywide PCI loan portfolio
or loans accounted for under the fair value option even though the
customer may be contractually past due. For additional information
on FHA loans, see Off-Balance Sheet Arrangements and
Contractual Obligations – Unresolved Claims Status on page 51.
Table 21
(Dollars in millions)
Residential mortgage (1)
Home equity
Discontinued real estate
U.S. credit card
Non-U.S. credit card
Direct/Indirect consumer
Other consumer
Total (2)
Consumer loans as a percentage of outstanding consumer loans (2)
Consumer loans as a percentage of outstanding loans excluding Countrywide PCI and fully-insured loan
portfolios (2)
Consumer Credit Quality
December 31
Accruing Past Due
90 Days or More
2011
$ 21,164
—
—
2,070
342
746
2
$ 24,324
4.01%
0.66
2010
$ 16,768
—
—
3,320
599
1,058
2
$ 21,747
3.38%
0.92
Nonperforming
2011
$15,970
2,453
290
n/a
n/a
40
15
$18,768
3.09%
3.90
2010
$ 17,691
2,694
331
n/a
n/a
90
48
$ 20,854
3.24%
3.85
(1) Balances accruing past due 90 days or more are fully-insured loans. These balances include $17.0 billion and $8.3 billion of loans on which interest has been curtailed by the FHA, and therefore
are no longer accruing interest, although principal is still insured and $4.2 billion and $8.5 billion of loans on which interest was still accruing at December 31, 2011 and 2010.
(2) Balances exclude consumer loans accounted for under the fair value option. At December 31, 2011, approximately $713 million of loans accounted for under the fair value option were past due 90
days or more and not accruing interest. There were no consumer loans accounted for under the fair value option at December 31, 2010.
n/a = not applicable