Bank of America 2011 Annual Report Download - page 118
Download and view the complete annual report
Please find page 118 of the 2011 Bank of America annual report below. You can navigate through the pages in the report by either clicking on the pages listed below, or by using the keyword search tool below to find specific information within the annual report.-
 1
1 -
2
-
3
-
4
-
5
-
6
-
7
-
8
-
9
-
10
-
11
-
12
-
13
-
14
-
15
-
16
-
17
-
18
-
19
-
20
-
21
-
22
-
23
-
24
-
25
-
26
-
27
-
28
-
29
-
30
-
31
-
32
-
33
-
34
-
35
-
36
-
37
-
38
-
39
-
40
-
41
-
42
-
43
-
44
-
45
-
46
-
47
-
48
-
49
-
50
-
51
-
52
-
53
-
54
-
55
-
56
-
57
-
58
-
59
-
60
-
61
-
62
-
63
-
64
-
65
-
66
-
67
-
68
-
69
-
70
-
71
-
72
-
73
-
74
-
75
-
76
-
77
-
78
-
79
-
80
-
81
-
82
-
83
-
84
-
85
-
86
-
87
-
88
-
89
-
90
-
91
-
92
-
93
-
94
-
95
-
96
-
97
-
98
-
99
-
100
-
101
-
102
-
103
-
104
-
105
-
106
-
107
-
 108
108 -
 109
109 -
 110
110 -
 111
111 -
 112
112 -
 113
113 -
 114
114 -
 115
115 -
 116
116 -
 117
117 -
 118
118 -
 119
119 -
 120
120 -
 121
121 -
 122
122 -
 123
123 -
 124
124 -
 125
125 -
 126
126 -
 127
127 -
 128
128 -
129
-
130
-
131
-
132
-
133
-
134
-
135
-
136
-
137
-
138
-
139
-
140
-
141
-
142
-
143
-
144
-
145
-
146
-
147
-
148
-
149
-
150
-
151
-
152
-
153
-
154
-
155
-
156
-
157
-
158
-
159
-
160
-
161
-
162
-
163
-
164
-
165
-
166
-
167
-
168
-
169
-
170
-
171
-
172
-
173
-
174
-
175
-
176
-
177
-
178
-
179
-
180
-
181
-
182
-
183
-
184
-
185
-
186
-
187
-
188
-
189
-
190
-
191
-
192
-
193
-
194
-
195
-
196
-
197
-
198
-
199
-
200
-
201
-
202
-
203
-
204
-
205
-
206
-
207
-
208
-
209
-
210
-
211
-
212
-
213
-
214
-
215
-
216
-
217
-
218
-
219
-
220
-
221
-
222
-
223
-
224
-
225
-
226
-
227
-
228
-
229
-
230
-
231
-
232
-
233
-
234
-
235
-
236
-
237
-
238
-
239
-
240
-
241
-
242
-
243
-
244
-
245
-
246
-
247
-
248
-
249
-
250
-
251
-
252
-
253
-
254
-
255
-
256
-
257
-
258
-
259
-
260
-
261
-
262
-
263
-
264
-
265
-
266
-
267
-
268
-
269
-
270
-
271
-
272
-
273
-
274
-
275
-
276
 |
 |
116 Bank of America 2011
more variability in market pricing or a lack of market data to use
in the valuation process. In keeping with the prudent application
of estimates and management judgment in determining the fair
value of assets and liabilities, we have in place various processes
and controls that include: a model validation policy that requires
review and approval of quantitative models used for deal pricing,
financial statement fair value determination and risk
quantification; a trading product valuation policy that requires
verification of all traded product valuations; and a periodic review
and substantiation of daily profit and loss reporting for all traded
products. Primarily through validation controls, we utilize both
broker and pricing service inputs which can and do include both
market-observable and internally-modeled values and/or valuation
inputs. Our reliance on this information is tempered by the
knowledge of how the broker and/or pricing service develops its
data with a higher degree of reliance applied to those that are
more directly observable and lesser reliance applied to those
developed through their own internal modeling. Similarly, broker
quotes that are executable are given a higher level of reliance than
indicative broker quotes, which are not executable. These
processes and controls are performed independently of the
business.
Trading account assets and liabilities are carried at fair value
based primarily on actively traded markets where prices are from
either direct market quotes or observed transactions. Liquidity is
a significant factor in the determination of the fair value of trading
account assets and liabilities. Market price quotes may not be
readily available for some positions, or positions within a market
sector where trading activity has slowed significantly or ceased.
Situations of illiquidity generally are triggered by market perception
of credit uncertainty regarding a single company or a specific
market sector. In these instances, fair value is determined based
on limited available market information and other factors,
principally from reviewing the issuer’s financial statements and
changes in credit ratings made by one or more of the rating
agencies.
Trading account profits, which represent the net amount earned
from our trading positions, can be volatile and are largely driven
by general market conditions and customer demand. Trading
account profits are dependent on the volume and type of
transactions, the level of risk assumed, and the volatility of price
and rate movements at any given time within the ever-changing
market environment. To evaluate risk in our trading activities, we
focus on the actual and potential volatility of individual positions
as well as portfolios. At a portfolio and corporate level, we use
trading limits, stress testing and tools such as VaR modeling, which
estimates a potential daily loss that we do not expect to exceed
with a specified confidence level, to measure and manage market
risk. For more information on VaR, see Trading Risk Management
on page 107.
The fair values of derivative assets and liabilities traded in the
OTC market are determined using quantitative models that require
the use of multiple market inputs including interest rates, prices
and indices to generate continuous yield or pricing curves and
volatility factors, which are used to value the positions. The majority
of market inputs are actively quoted and can be validated through
external sources including brokers, market transactions and third-
party pricing services. Estimation risk is greater for derivative asset
and liability positions that are either option-based or have longer
maturity dates where observable market inputs are less readily
available or are unobservable, in which case quantitative-based
extrapolations of rate, price or index scenarios are used in
determining fair values. The Corporation incorporates within its
fair value measurements of OTC derivatives a valuation adjustment
to reflect the credit risk associated with the net position. Positions
are netted by counterparty and fair value for net long exposures
is adjusted for counterparty credit risk while the fair value for net
short exposures is adjusted for our own credit risk. The credit
adjustments are determined by reference to existing direct market
reference costs of credit, or where direct references are not
available, a proxy is applied consistent with direct references for
other counterparties that are similar in credit risk. An estimate of
severity of loss is also used in the determination of fair value,
primarily based on market implied experience adjusted for any
more recent name specific expectations.
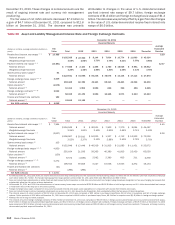
Level 3 Assets and Liabilities
Financial assets and liabilities whose values are based on
valuation techniques that require inputs that are both
unobservable and are significant to the overall fair value
measurement are classified as Level 3 under the fair value
hierarchy established in applicable accounting guidance. The Level
3 financial assets and liabilities include consumer MSRs, highly
structured, complex or long-dated derivative contracts and private
equity investments, as well as certain loans, MBS, ABS, structured
liabilities and CDOs. The fair value of these Level 3 financial assets
and liabilities is determined using pricing models, discounted cash
flow methodologies or similar techniques for which the
determination of fair value requires significant management
judgment or estimation.