Bank of America 2011 Annual Report Download - page 85
Download and view the complete annual report
Please find page 85 of the 2011 Bank of America annual report below. You can navigate through the pages in the report by either clicking on the pages listed below, or by using the keyword search tool below to find specific information within the annual report.-
 1
1 -
2
-
3
-
4
-
5
-
6
-
7
-
8
-
9
-
10
-
11
-
12
-
13
-
14
-
15
-
16
-
17
-
18
-
19
-
20
-
21
-
22
-
23
-
24
-
25
-
26
-
27
-
28
-
29
-
30
-
31
-
32
-
33
-
34
-
35
-
36
-
37
-
38
-
39
-
40
-
41
-
42
-
43
-
44
-
45
-
46
-
47
-
48
-
49
-
50
-
51
-
52
-
53
-
54
-
55
-
56
-
57
-
58
-
59
-
60
-
61
-
62
-
63
-
64
-
65
-
66
-
67
-
68
-
69
-
70
-
71
-
72
-
73
-
74
-
 75
75 -
 76
76 -
 77
77 -
 78
78 -
 79
79 -
 80
80 -
 81
81 -
 82
82 -
 83
83 -
 84
84 -
 85
85 -
 86
86 -
 87
87 -
 88
88 -
 89
89 -
 90
90 -
 91
91 -
 92
92 -
 93
93 -
 94
94 -
 95
95 -
96
-
97
-
98
-
99
-
100
-
101
-
102
-
103
-
104
-
105
-
106
-
107
-
108
-
109
-
110
-
111
-
112
-
113
-
114
-
115
-
116
-
117
-
118
-
119
-
120
-
121
-
122
-
123
-
124
-
125
-
126
-
127
-
128
-
129
-
130
-
131
-
132
-
133
-
134
-
135
-
136
-
137
-
138
-
139
-
140
-
141
-
142
-
143
-
144
-
145
-
146
-
147
-
148
-
149
-
150
-
151
-
152
-
153
-
154
-
155
-
156
-
157
-
158
-
159
-
160
-
161
-
162
-
163
-
164
-
165
-
166
-
167
-
168
-
169
-
170
-
171
-
172
-
173
-
174
-
175
-
176
-
177
-
178
-
179
-
180
-
181
-
182
-
183
-
184
-
185
-
186
-
187
-
188
-
189
-
190
-
191
-
192
-
193
-
194
-
195
-
196
-
197
-
198
-
199
-
200
-
201
-
202
-
203
-
204
-
205
-
206
-
207
-
208
-
209
-
210
-
211
-
212
-
213
-
214
-
215
-
216
-
217
-
218
-
219
-
220
-
221
-
222
-
223
-
224
-
225
-
226
-
227
-
228
-
229
-
230
-
231
-
232
-
233
-
234
-
235
-
236
-
237
-
238
-
239
-
240
-
241
-
242
-
243
-
244
-
245
-
246
-
247
-
248
-
249
-
250
-
251
-
252
-
253
-
254
-
255
-
256
-
257
-
258
-
259
-
260
-
261
-
262
-
263
-
264
-
265
-
266
-
267
-
268
-
269
-
270
-
271
-
272
-
273
-
274
-
275
-
276
 |
 |

Bank of America 2011 83
Countrywide Purchased Credit-impaired Loan Portfolio
Loans acquired with evidence of credit quality deterioration since
origination and for which it is probable at purchase that we will be
unable to collect all contractually required payments are accounted
for under the accounting guidance for PCI loans, which addresses
accounting for differences between contractual and expected cash
flows to be collected from the purchaser’s initial investment in
loans if those differences are attributable, at least in part, to credit
quality. Evidence of credit quality deterioration as of the acquisition
date may include statistics such as past due status, refreshed
FICO scores and refreshed LTVs. PCI loans are recorded at fair
value upon acquisition and the applicable accounting guidance
prohibits carrying over or recording a valuation allowance in the
initial accounting.
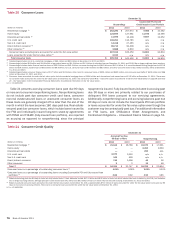
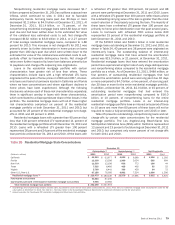
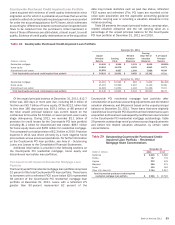
Table 28 presents the unpaid principal balance, carrying value,
related valuation allowance and the net carrying value as a
percentage of the unpaid principal balance for the Countrywide
PCI loan portfolio at December 31, 2011 and 2010.
Table 28
(Dollars in millions)
Residential mortgage
Home equity
Discontinued real estate
Total Countrywide purchased credit-impaired loan portfolio
Residential mortgage
Home equity
Discontinued real estate
Total Countrywide purchased credit-impaired loan portfolio
Countrywide Purchased Credit-impaired Loan Portfolio
December 31, 2011
Unpaid
Principal
Balance
$ 10,426
12,516
11,891
$ 34,833
December 31, 2010
$ 11,481
15,072
14,893
$ 41,446
Carrying
Value
$ 9,966
11,978
9,857
$ 31,801
$ 10,592
12,590
11,652
$ 34,834
Related
Valuation
Allowance
$ 1,331
5,129
1,999
$ 8,459
$ 663
4,467
1,204
$ 6,334
Carrying
Value Net of
Valuation
Allowance
$ 8,635
6,849
7,858
$23,342
$ 9,929
8,123
10,448
$ 28,500
% of Unpaid
Principal
Balance
82.82%
54.72
66.08
67.01
86.48%
53.89
70.15
68.76
Of the unpaid principal balance at December 31, 2011, $12.7
billion was 180 days or more past due, including $9.0 billion of
first-lien and $3.7 billion of home equity. Of the $22.1 billion that
is less than 180 days past due, $19.1 billion, or 86 percent of
the total unpaid principal balance was current based on the
contractual terms while $1.6 billion, or seven percent, was in early
stage delinquency. During 2011, we recorded $2.1 billion of
provision for credit losses for the Countrywide PCI loan portfolio
including $1.1 billion for discontinued real estate, $667 million
for home equity loans and $355 million for residential mortgage.
This compared to a total provision of $2.3 billion in 2010. Provision
expense in 2011 was driven primarily by a more negative home
price outlook versus previous expectations. For further information
on the Countrywide PCI loan portfolio, see Note 6 – Outstanding
Loans and Leases to the Consolidated Financial Statements.
Additional information is provided in the following sections on
the Countrywide PCI residential mortgage, home equity and
discontinued real estate loan portfolios.
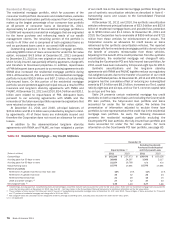
Purchased Credit-impaired Residential Mortgage Loan
Portfolio
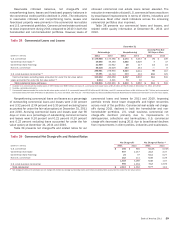
The Countrywide PCI residential mortgage loan portfolio comprised
31 percent of the total Countrywide PCI loan portfolio. Those loans
to borrowers with a refreshed FICO score below 620 represented
38 percent of the Countrywide PCI residential mortgage loan
portfolio at December 31, 2011. Loans with a refreshed LTV
greater than 90 percent represented 62 percent of the
Countrywide PCI residential mortgage loan portfolio after
consideration of purchase accounting adjustments and the related
valuation allowance, and 84 percent based on the unpaid principal
balance at December 31, 2011. Those loans that were originally
classified as Countrywide PCI discontinued real estate loans upon
acquisition and have been subsequently modified are now included
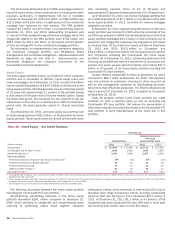
in the Countrywide PCI residential mortgage outstandings. Table
29 presents outstandings net of purchase accounting adjustments
and before the related valuation allowance, by certain state
concentrations.
Table 29
(Dollars in millions)
California
Florida
Virginia
Maryland
Texas
Other U.S./Non-U.S.
Total Countrywide purchased credit-impaired
residential mortgage loan portfolio
Outstanding Countrywide Purchased Credit-
impaired Loan Portfolio – Residential
Mortgage State Concentrations
December 31
2011
$ 5,535
757
532
258
130
2,754
$ 9,966
2010
$ 5,882
779
579
271
164
2,917
$ 10,592