Bank of America 2011 Annual Report Download - page 183
Download and view the complete annual report
Please find page 183 of the 2011 Bank of America annual report below. You can navigate through the pages in the report by either clicking on the pages listed below, or by using the keyword search tool below to find specific information within the annual report.-
 1
1 -
2
-
3
-
4
-
5
-
6
-
7
-
8
-
9
-
10
-
11
-
12
-
13
-
14
-
15
-
16
-
17
-
18
-
19
-
20
-
21
-
22
-
23
-
24
-
25
-
26
-
27
-
28
-
29
-
30
-
31
-
32
-
33
-
34
-
35
-
36
-
37
-
38
-
39
-
40
-
41
-
42
-
43
-
44
-
45
-
46
-
47
-
48
-
49
-
50
-
51
-
52
-
53
-
54
-
55
-
56
-
57
-
58
-
59
-
60
-
61
-
62
-
63
-
64
-
65
-
66
-
67
-
68
-
69
-
70
-
71
-
72
-
73
-
74
-
75
-
76
-
77
-
78
-
79
-
80
-
81
-
82
-
83
-
84
-
85
-
86
-
87
-
88
-
89
-
90
-
91
-
92
-
93
-
94
-
95
-
96
-
97
-
98
-
99
-
100
-
101
-
102
-
103
-
104
-
105
-
106
-
107
-
108
-
109
-
110
-
111
-
112
-
113
-
114
-
115
-
116
-
117
-
118
-
119
-
120
-
121
-
122
-
123
-
124
-
125
-
126
-
127
-
128
-
129
-
130
-
131
-
132
-
133
-
134
-
135
-
136
-
137
-
138
-
139
-
140
-
141
-
142
-
143
-
144
-
145
-
146
-
147
-
148
-
149
-
150
-
151
-
152
-
153
-
154
-
155
-
156
-
157
-
158
-
159
-
160
-
161
-
162
-
163
-
164
-
165
-
166
-
167
-
168
-
169
-
170
-
171
-
172
-
 173
173 -
 174
174 -
 175
175 -
 176
176 -
 177
177 -
 178
178 -
 179
179 -
 180
180 -
 181
181 -
 182
182 -
 183
183 -
 184
184 -
 185
185 -
 186
186 -
 187
187 -
 188
188 -
 189
189 -
 190
190 -
 191
191 -
 192
192 -
 193
193 -
194
-
195
-
196
-
197
-
198
-
199
-
200
-
201
-
202
-
203
-
204
-
205
-
206
-
207
-
208
-
209
-
210
-
211
-
212
-
213
-
214
-
215
-
216
-
217
-
218
-
219
-
220
-
221
-
222
-
223
-
224
-
225
-
226
-
227
-
228
-
229
-
230
-
231
-
232
-
233
-
234
-
235
-
236
-
237
-
238
-
239
-
240
-
241
-
242
-
243
-
244
-
245
-
246
-
247
-
248
-
249
-
250
-
251
-
252
-
253
-
254
-
255
-
256
-
257
-
258
-
259
-
260
-
261
-
262
-
263
-
264
-
265
-
266
-
267
-
268
-
269
-
270
-
271
-
272
-
273
-
274
-
275
-
276
 |
 |

Bank of America 2011 181
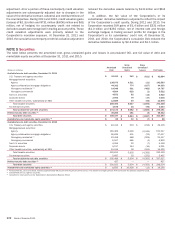
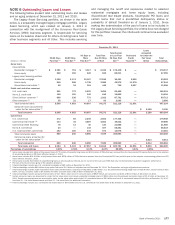
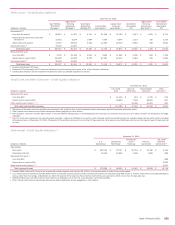
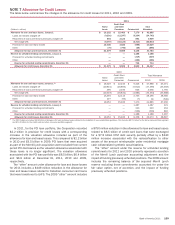
Home Loans - Credit Quality Indicators
(Dollars in millions)
Refreshed LTV (2)
Less than 90 percent
Greater than 90 percent but less than
100 percent
Greater than 100 percent
Fully-insured loans (3)
Total home loans
Refreshed FICO score
Less than 620
Greater than or equal to 620
Fully-insured loans (3)
Total home loans
December 31, 2010
Core Portfolio
Residential
Mortgage (1)
$ 95,874
11,581
14,047
45,425
$ 166,927
$ 5,193
116,309
45,425
$ 166,927
Legacy Asset
Servicing
Residential
Mortgage (1)
$ 21,357
8,234
29,043
21,820
$ 80,454
$ 22,126
36,508
21,820
$ 80,454
Countrywide
Residential
Mortgage PCI
$ 3,710
1,664
5,218
—
$ 10,592
$ 4,016
6,576
—
$ 10,592
Core Portfolio
Home Equity (1)
$ 51,555
7,534
12,430
—
$ 71,519
$ 3,932
67,587
—
$ 71,519
Legacy Asset
Servicing
Home Equity (1)
$ 22,125
6,504
25,243
—
$ 53,872
$ 11,562
42,310
—
$ 53,872
Countrywide
Hone Equity
PCI
$ 2,313
1,215
9,062
—
$ 12,590
$ 3,206
9,384
—
$ 12,590
Legacy Asset
Servicing
Discontinued
Real Estate (1)
$ 1,033
155
268
—
$ 1,456
$663
793
—
$ 1,456
Countrywide
Discontinued
Real Estate
PCI
$6,713
1,319
3,620
—
$11,652
$7,168
4,484
—
$11,652
(1) Excludes Countrywide PCI loans.
(2) Refreshed LTV percentages for PCI loans are calculated using the carrying value gross of the related valuation allowance.
(3) Credit quality indicators are not reported for fully-insured loans as principal repayment is insured.
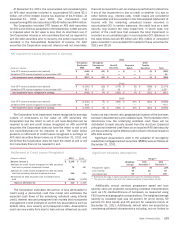
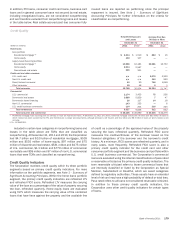
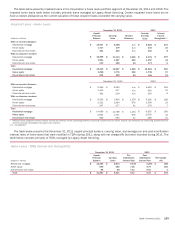
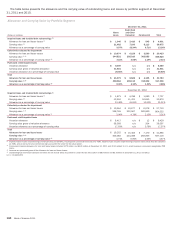
Credit Card and Other Consumer - Credit Quality Indicators
(Dollars in millions)
Refreshed FICO score
Less than 620
Greater than or equal to 620
Other internal credit metrics (2, 3, 4)
Total credit card and other consumer
December 31, 2010
U.S. Credit
Card
$ 14,159
99,626
—
$ 113,785
Non-U.S.
Credit Card
$ 631
7,528
19,306
$ 27,465
Direct/Indirect
Consumer
$ 6,748
48,209
35,351
$90,308
Other
Consumer (1)
$979
961
890
$2,830
(1) 96 percent of the other consumer portfolio was associated with portfolios from certain consumer finance businesses that the Corporation previously exited.
(2) Other internal credit metrics may include delinquency status, geography or other factors.
(3) Direct/indirect consumer includes $24.0 billion of securities-based lending which is overcollateralized and therefore has minimal credit risk and $7.4 billion of loans the Corporation no longer
originates.
(4) Non-U.S. credit card represents the select European countries’ credit card portfolios and a portion of the Canadian credit card portfolio which are evaluated using internal credit metrics, including
delinquency status. At December 31, 2010, 95 percent of this portfolio was current or less than 30 days past due, three percent was 30-89 days past due and two percent was 90 days past due
or more.
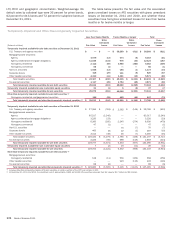
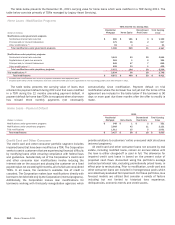
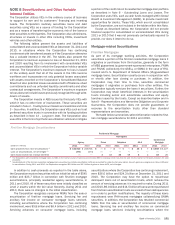
Commercial - Credit Quality Indicators (1)
(Dollars in millions)
Risk Ratings
Pass rated
Reservable criticized
Refreshed FICO score (3)
Less than 620
Greater than or equal to 620
Other internal credit metrics (3, 4)
Total commercial credit
December 31, 2010
U.S.
Commercial
$ 160,154
15,432
$ 175,586
Commercial
Real Estate
$ 29,757
19,636
$ 49,393
Commercial
Lease
Financing
$ 20,754
1,188
$ 21,942
Non-U.S.
Commercial
$30,180
1,849
$32,029
U.S. Small
Business
Commercial (2)
$3,139
988
888
5,083
4,621
$14,719
(1) Includes $204 million of PCI loans in the commercial portfolio segment and excludes $3.3 billion of loans accounted for under the fair value option.
(2) U.S. small business commercial includes $690 million of criticized business card and small business loans which are evaluated using FICO scores or internal credit metrics, including delinquency
status, rather than risk ratings. At December 31, 2010, 95 percent of the balances where internal credit metrics are used were current or less than 30 days past due.
(3) Refreshed FICO score and other internal credit metrics are applicable only to the U.S. small business commercial portfolio.
(4) Other internal credit metrics may include delinquency status, application scores, geography or other factors.