Bank of America 2011 Annual Report Download - page 185
Download and view the complete annual report
Please find page 185 of the 2011 Bank of America annual report below. You can navigate through the pages in the report by either clicking on the pages listed below, or by using the keyword search tool below to find specific information within the annual report.-
 1
1 -
2
-
3
-
4
-
5
-
6
-
7
-
8
-
9
-
10
-
11
-
12
-
13
-
14
-
15
-
16
-
17
-
18
-
19
-
20
-
21
-
22
-
23
-
24
-
25
-
26
-
27
-
28
-
29
-
30
-
31
-
32
-
33
-
34
-
35
-
36
-
37
-
38
-
39
-
40
-
41
-
42
-
43
-
44
-
45
-
46
-
47
-
48
-
49
-
50
-
51
-
52
-
53
-
54
-
55
-
56
-
57
-
58
-
59
-
60
-
61
-
62
-
63
-
64
-
65
-
66
-
67
-
68
-
69
-
70
-
71
-
72
-
73
-
74
-
75
-
76
-
77
-
78
-
79
-
80
-
81
-
82
-
83
-
84
-
85
-
86
-
87
-
88
-
89
-
90
-
91
-
92
-
93
-
94
-
95
-
96
-
97
-
98
-
99
-
100
-
101
-
102
-
103
-
104
-
105
-
106
-
107
-
108
-
109
-
110
-
111
-
112
-
113
-
114
-
115
-
116
-
117
-
118
-
119
-
120
-
121
-
122
-
123
-
124
-
125
-
126
-
127
-
128
-
129
-
130
-
131
-
132
-
133
-
134
-
135
-
136
-
137
-
138
-
139
-
140
-
141
-
142
-
143
-
144
-
145
-
146
-
147
-
148
-
149
-
150
-
151
-
152
-
153
-
154
-
155
-
156
-
157
-
158
-
159
-
160
-
161
-
162
-
163
-
164
-
165
-
166
-
167
-
168
-
169
-
170
-
171
-
172
-
173
-
174
-
 175
175 -
 176
176 -
 177
177 -
 178
178 -
 179
179 -
 180
180 -
 181
181 -
 182
182 -
 183
183 -
 184
184 -
 185
185 -
 186
186 -
 187
187 -
 188
188 -
 189
189 -
 190
190 -
 191
191 -
 192
192 -
 193
193 -
 194
194 -
 195
195 -
196
-
197
-
198
-
199
-
200
-
201
-
202
-
203
-
204
-
205
-
206
-
207
-
208
-
209
-
210
-
211
-
212
-
213
-
214
-
215
-
216
-
217
-
218
-
219
-
220
-
221
-
222
-
223
-
224
-
225
-
226
-
227
-
228
-
229
-
230
-
231
-
232
-
233
-
234
-
235
-
236
-
237
-
238
-
239
-
240
-
241
-
242
-
243
-
244
-
245
-
246
-
247
-
248
-
249
-
250
-
251
-
252
-
253
-
254
-
255
-
256
-
257
-
258
-
259
-
260
-
261
-
262
-
263
-
264
-
265
-
266
-
267
-
268
-
269
-
270
-
271
-
272
-
273
-
274
-
275
-
276
 |
 |

Bank of America 2011 183
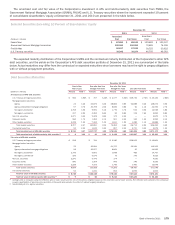
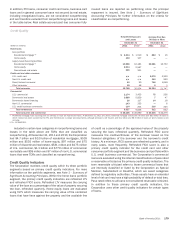
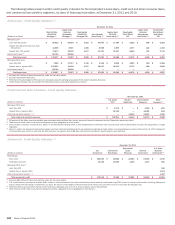
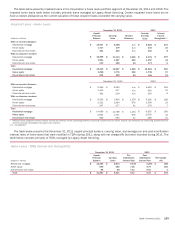
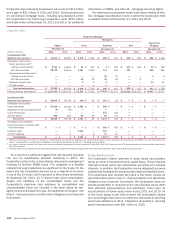
The table below presents impaired loans in the Corporation’s home loans portfolio segment at December 31, 2011 and 2010. The
impaired home loans table below includes primarily loans managed by Legacy Asset Servicing. Certain impaired home loans do not
have a related allowance as the current valuation of these impaired loans exceeded the carrying value.
Impaired Loans – Home Loans
(Dollars in millions)
With no recorded allowance
Residential mortgage
Home equity
Discontinued real estate
With an allowance recorded
Residential mortgage
Home equity
Discontinued real estate
Total
Residential mortgage
Home equity
Discontinued real estate
With no recorded allowance
Residential mortgage
Home equity
Discontinued real estate
With an allowance recorded
Residential mortgage
Home equity
Discontinued real estate
Total
Residential mortgage
Home equity
Discontinued real estate
December 31, 2011
Unpaid
Principal
Balance
$ 10,907
1,747
421
$ 12,296
1,551
213
$ 23,203
3,298
634
December 31, 2010
$ 5,493
1,411
361
$ 8,593
1,521
247
$ 14,086
2,932
608
Carrying
Value
$ 8,168
479
240
$ 11,119
1,297
159
$ 19,287
1,776
399
$ 4,382
437
218
$ 7,406
1,284
177
$ 11,788
1,721
395
Related
Allowance
n/a
n/a
n/a
$ 1,295
622
29
$ 1,295
622
29
n/a
n/a
n/a
$ 1,154
676
41
$ 1,154
676
41
2011
Average
Carrying
Value
$ 6,285
442
222
$ 9,379
1,357
173
$15,664
1,799
395
2010
$ 4,429
493
219
$5,226
1,509
170
$ 9,655
2,002
389
Interest
Income
Recognized (1)
$ 233
23
8
$ 319
34
6
$ 552
57
14
$ 184
21
8
$ 196
23
7
$ 380
44
15
(1) Interest income recognized includes interest accrued and collected on the outstanding balances of accruing impaired loans as well as interest cash collections on nonaccruing impaired loans for
which the ultimate collectability of principal is not uncertain.
n/a = not applicable
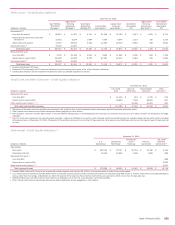
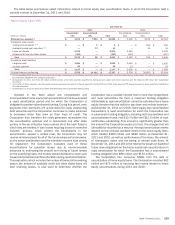
The table below presents the December 31, 2011 unpaid principal balance, carrying value, and average pre- and post-modification
interest rates of home loans that were modified in TDRs during 2011, along with net charge-offs that were recorded during 2011. The
table below consists primarily of TDRs managed by Legacy Asset Servicing.
Home Loans - TDRs Entered into During 2011
(Dollars in millions)
Residential mortgage
Home equity
Discontinued real estate
Total
December 31, 2011
Unpaid
Principal
Balance
$ 10,293
899
89
$ 11,281
Carrying
Value
$ 8,872
480
59
$ 9,411
2011
Pre-
modification
Interest Rate
6.03%
7.05
7.42
6.12
Post-
modification
Interest Rate
5.28%
5.79
5.94
5.33
Net Charge-
offs
$ 188
184
3
$ 375