Bank of America 2011 Annual Report Download - page 4
Download and view the complete annual report
Please find page 4 of the 2011 Bank of America annual report below. You can navigate through the pages in the report by either clicking on the pages listed below, or by using the keyword search tool below to find specific information within the annual report.-
 1
1 -
 2
2 -
 3
3 -
 4
4 -
 5
5 -
 6
6 -
 7
7 -
 8
8 -
 9
9 -
 10
10 -
 11
11 -
 12
12 -
 13
13 -
 14
14 -
 15
15 -
16
-
17
-
18
-
19
-
20
-
21
-
22
-
23
-
24
-
25
-
26
-
27
-
28
-
29
-
30
-
31
-
32
-
33
-
34
-
35
-
36
-
37
-
38
-
39
-
40
-
41
-
42
-
43
-
44
-
45
-
46
-
47
-
48
-
49
-
50
-
51
-
52
-
53
-
54
-
55
-
56
-
57
-
58
-
59
-
60
-
61
-
62
-
63
-
64
-
65
-
66
-
67
-
68
-
69
-
70
-
71
-
72
-
73
-
74
-
75
-
76
-
77
-
78
-
79
-
80
-
81
-
82
-
83
-
84
-
85
-
86
-
87
-
88
-
89
-
90
-
91
-
92
-
93
-
94
-
95
-
96
-
97
-
98
-
99
-
100
-
101
-
102
-
103
-
104
-
105
-
106
-
107
-
108
-
109
-
110
-
111
-
112
-
113
-
114
-
115
-
116
-
117
-
118
-
119
-
120
-
121
-
122
-
123
-
124
-
125
-
126
-
127
-
128
-
129
-
130
-
131
-
132
-
133
-
134
-
135
-
136
-
137
-
138
-
139
-
140
-
141
-
142
-
143
-
144
-
145
-
146
-
147
-
148
-
149
-
150
-
151
-
152
-
153
-
154
-
155
-
156
-
157
-
158
-
159
-
160
-
161
-
162
-
163
-
164
-
165
-
166
-
167
-
168
-
169
-
170
-
171
-
172
-
173
-
174
-
175
-
176
-
177
-
178
-
179
-
180
-
181
-
182
-
183
-
184
-
185
-
186
-
187
-
188
-
189
-
190
-
191
-
192
-
193
-
194
-
195
-
196
-
197
-
198
-
199
-
200
-
201
-
202
-
203
-
204
-
205
-
206
-
207
-
208
-
209
-
210
-
211
-
212
-
213
-
214
-
215
-
216
-
217
-
218
-
219
-
220
-
221
-
222
-
223
-
224
-
225
-
226
-
227
-
228
-
229
-
230
-
231
-
232
-
233
-
234
-
235
-
236
-
237
-
238
-
239
-
240
-
241
-
242
-
243
-
244
-
245
-
246
-
247
-
248
-
249
-
250
-
251
-
252
-
253
-
254
-
255
-
256
-
257
-
258
-
259
-
260
-
261
-
262
-
263
-
264
-
265
-
266
-
267
-
268
-
269
-
270
-
271
-
272
-
273
-
274
-
275
-
276
 |
 |

2
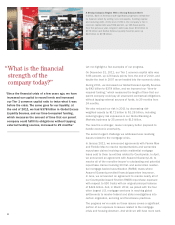
“ What is the financial
strength of the
company today?”
Let me highlight a few examples of our progress.
On December 31, 2011, our Tier 1 common capital ratio was
9.86 percent, up 126 basis points from the end of 2010, and
double the level in 2007 as we headed into the economic crisis.
During 2011, we increased our Global Excess Liquidity Sources
by $42 billion to $378 billion, and we improved our “time-to-
required funding,” which measures the length of time that our
parent company could pay all unsecured contractual obligations
without tapping external sources of funds, to 29 months from
24 months.
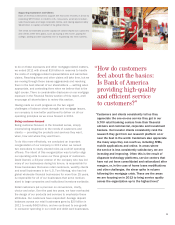
We also reduced our risk in 2011 by decreasing risk-
weighted assets by $171 billion to $1.28 trillion, including
reducing legacy risk exposures in our Global Banking &
Markets business by 35 percent to $15 billion.
The result is a stronger, leaner company better prepared to
handle economic uncertainty.
The second urgent challenge we addressed was resolving
issues related to the mortgage crisis.
In January 2011, we announced agreements with Fannie Mae
and Freddie Mac to resolve representations and warranties
repurchase claims involving certain residential mortgage
loans sold to them by entities related to Countrywide. In April,
we announced an agreement with Assured Guaranty Ltd. to
resolve all of the monoline insurer’s outstanding and potential
repurchase claims involving 29 first- and second-lien residen-
tial mortgage-backed securitization (RMBS) trusts where
Assured Guaranty provided financial guarantee insurance.
In June, we announced an agreement to resolve nearly all of
our Countrywide-issued first-lien RMBS repurchase exposure
with respect to 530 trusts with an original principal balance
of $424 billion. And, in March 2012, we joined with the four
other largest U.S. mortgage servicers in reaching global
settlements to resolve federal and state investigations into
certain origination, servicing and foreclosure practices.
The progress we’ve made on these issues covers a significant
portion of our exposure to issues related to the mortgage
crisis and housing downturn. And while we still have more work
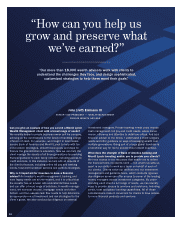
“ Since the financial crisis of a few years ago, we have
increased our capital to record levels and increased
our Tier 1 common capital ratio to twice what it was
before the crisis. The same goes for our liquidity; at
the end of 2011, we had $378 billion in Global Excess
Liquidity Sources, and our time-to-required funding,
which measures the amount of time that our parent
company could fulfill its obligations without tapping
external funding sources, increased to 29 months.”
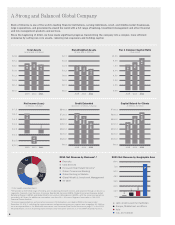
A Strong Company Begins With a Strong Balance Sheet
In 2011, Bank of America made significant progress to streamline
its balance sheet by selling non-core assets, building capital
and reducing debt. At the end of 2011, the company’s Tier 1
common capital ratio was 9.86 percent, up 126 basis points
from the previous year, long-term debt was down $76 billion to
$372 billion and Global Excess Liquidity Sources were up
$42 billion to $378 billion.