Bank of America 2011 Annual Report Download - page 29
Download and view the complete annual report
Please find page 29 of the 2011 Bank of America annual report below. You can navigate through the pages in the report by either clicking on the pages listed below, or by using the keyword search tool below to find specific information within the annual report.-
 1
1 -
2
-
3
-
4
-
5
-
6
-
7
-
8
-
9
-
10
-
11
-
12
-
13
-
14
-
15
-
16
-
17
-
18
-
 19
19 -
 20
20 -
 21
21 -
 22
22 -
 23
23 -
 24
24 -
 25
25 -
 26
26 -
 27
27 -
 28
28 -
 29
29 -
 30
30 -
 31
31 -
 32
32 -
 33
33 -
 34
34 -
 35
35 -
 36
36 -
 37
37 -
 38
38 -
 39
39 -
40
-
41
-
42
-
43
-
44
-
45
-
46
-
47
-
48
-
49
-
50
-
51
-
52
-
53
-
54
-
55
-
56
-
57
-
58
-
59
-
60
-
61
-
62
-
63
-
64
-
65
-
66
-
67
-
68
-
69
-
70
-
71
-
72
-
73
-
74
-
75
-
76
-
77
-
78
-
79
-
80
-
81
-
82
-
83
-
84
-
85
-
86
-
87
-
88
-
89
-
90
-
91
-
92
-
93
-
94
-
95
-
96
-
97
-
98
-
99
-
100
-
101
-
102
-
103
-
104
-
105
-
106
-
107
-
108
-
109
-
110
-
111
-
112
-
113
-
114
-
115
-
116
-
117
-
118
-
119
-
120
-
121
-
122
-
123
-
124
-
125
-
126
-
127
-
128
-
129
-
130
-
131
-
132
-
133
-
134
-
135
-
136
-
137
-
138
-
139
-
140
-
141
-
142
-
143
-
144
-
145
-
146
-
147
-
148
-
149
-
150
-
151
-
152
-
153
-
154
-
155
-
156
-
157
-
158
-
159
-
160
-
161
-
162
-
163
-
164
-
165
-
166
-
167
-
168
-
169
-
170
-
171
-
172
-
173
-
174
-
175
-
176
-
177
-
178
-
179
-
180
-
181
-
182
-
183
-
184
-
185
-
186
-
187
-
188
-
189
-
190
-
191
-
192
-
193
-
194
-
195
-
196
-
197
-
198
-
199
-
200
-
201
-
202
-
203
-
204
-
205
-
206
-
207
-
208
-
209
-
210
-
211
-
212
-
213
-
214
-
215
-
216
-
217
-
218
-
219
-
220
-
221
-
222
-
223
-
224
-
225
-
226
-
227
-
228
-
229
-
230
-
231
-
232
-
233
-
234
-
235
-
236
-
237
-
238
-
239
-
240
-
241
-
242
-
243
-
244
-
245
-
246
-
247
-
248
-
249
-
250
-
251
-
252
-
253
-
254
-
255
-
256
-
257
-
258
-
259
-
260
-
261
-
262
-
263
-
264
-
265
-
266
-
267
-
268
-
269
-
270
-
271
-
272
-
273
-
274
-
275
-
276
 |
 |

Bank of America 2011 27
These decreases were partially offset by ongoing reductions in our
debt footprint and lower interest rates paid on deposits. The net
interest yield on a FTE basis decreased 30 bps to 2.48 percent
for 2011 compared to 2010 as the yield continues to be under
pressure due to the aforementioned items and the low rate
environment. We expect net interest income to continue to be
muted based on the current forward yield curve in 2012.
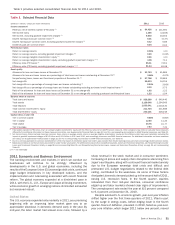
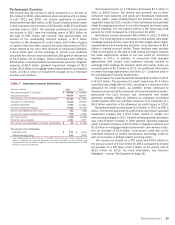
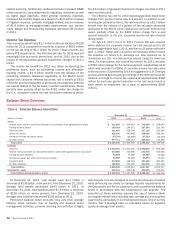
Noninterest Income
Table 4
(Dollars in millions)
Card income
Service charges
Investment and brokerage services
Investment banking income
Equity investment income
Trading account profits
Mortgage banking income (loss)
Insurance income
Gains on sales of debt securities
Other income
Net impairment losses recognized in earnings on
available-for-sale debt securities
Total noninterest income
Noninterest Income
2011
$ 7,184
8,094
11,826
5,217
7,360
6,697
(8,830)
1,346
3,374
6,869
(299)
$ 48,838
2010
$ 8,108
9,390
11,622
5,520
5,260
10,054
2,734
2,066
2,526
2,384
(967)
$ 58,697
Noninterest income decreased $9.9 billion to $48.8 billion for
2011 compared to 2010. The following highlights the significant
changes.
Card income decreased $924 million primarily due to the
implementation of new interchange fee rules under the Durbin
Amendment, which became effective on October 1, 2011 and
the CARD Act provisions that were implemented during 2010.
Service charges decreased $1.3 billion largely due to the impact
of overdraft policy changes in conjunction with Regulation E,
which became effective in the third quarter of 2010.
Equity investment income increased $2.1 billion. The results for
2011 included $6.5 billion of gains on the sale of CCB shares,
$836 million of CCB dividends and a $377 million gain on the
sale of our investment in BlackRock, Inc. (BlackRock), partially
offset by $1.1 billion of impairment charges on our merchant
services joint venture. The prior year included $2.5 billion of net
gains which included the sales of certain strategic investments,
$2.3 billion of gains in our Global Principal Investments (GPI)
portfolio which included both cash gains and fair value
adjustments, and $535 million of CCB dividends.
Trading account profits decreased $3.4 billion primarily due to
adverse market conditions and extreme volatility in the credit
markets compared to the prior year. DVA gains, net of hedges,
on derivatives were $1.0 billion in 2011 compared to $262
million in 2010 as a result of a widening of our credit spreads.
In conjunction with regulatory reform measures GBAM exited its
stand-alone proprietary trading business as of June 30, 2011.
Proprietary trading revenue was $434 million for the six months
ended June 30, 2011 compared to $1.4 billion for 2010.
Mortgage banking income decreased $11.6 billion primarily due
to an $8.8 billion increase in the representations and warranties
provision which was largely related to the BNY Mellon
Settlement. Also contributing to the decline was lower
production income due to a reduction in new loan origination
volumes partially offset by an increase in servicing income.
Other income increased $4.5 billion primarily due to positive
fair value adjustments of $3.3 billion related to widening of our
own credit spreads on structured liabilities compared to $18
million in 2010. In addition, 2011 included a $771 million gain
on the sale of Balboa as well as a $1.2 billion gain on the
exchange of certain trust preferred securities for common stock
and debt.
Provision for Credit Losses
The provision for credit losses decreased $15.0 billion to $13.4
billion for 2011 compared to 2010. The provision for credit losses
was $7.4 billion lower than net charge-offs for 2011, resulting in
a reduction in the allowance for credit losses driven primarily by
lower delinquencies, improved collection rates and fewer
bankruptcy filings across the Card Services portfolio, and
improvement in overall credit quality in the commercial real estate
portfolio partially offset by additions to consumer PCI loan portfolio
reserves. This compared to a $5.9 billion reduction in the
allowance for credit losses in 2010. We expect reductions in the
allowance for credit losses to be lower in 2012.
The provision for credit losses related to our consumer portfolio
decreased $11.1 billion to $14.3 billion for 2011 compared to
2010. The provision for credit losses related to our commercial
portfolio including the provision for unfunded lending commitments
decreased $3.9 billion to a benefit of $915 million for 2011
compared to 2010.
Net charge-offs totaled $20.8 billion, or 2.24 percent of average
loans and leases for 2011 compared to $34.3 billion, or 3.60
percent for 2010. The decrease in net charge-offs was primarily
driven by improvements in general economic conditions that
resulted in lower delinquencies, improved collection rates and
fewer bankruptcy filings across the Card Services portfolio as well
as lower losses in the home equity portfolio driven primarily by
fewer delinquent loans. For more information on the provision for
credit losses, see Provision for Credit Losses on page 102.
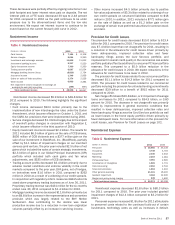
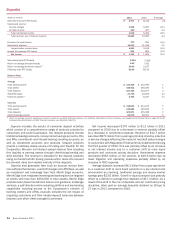
Noninterest Expense
Table 5
(Dollars in millions)
Personnel
Occupancy
Equipment
Marketing
Professional fees
Amortization of intangibles
Data processing
Telecommunications
Other general operating
Goodwill impairment
Merger and restructuring charges
Total noninterest expense
Noninterest Expense
2011
$ 36,965
4,748
2,340
2,203
3,381
1,509
2,652
1,553
21,101
3,184
638
$ 80,274
2010
$ 35,149
4,716
2,452
1,963
2,695
1,731
2,544
1,416
16,222
12,400
1,820
$ 83,108
Noninterest expense decreased $2.8 billion to $80.3 billion
for 2011 compared to 2010. The prior year included goodwill
impairment charges of $12.4 billion compared to $3.2 billion for
2011.
Personnel expense increased $1.8 billion for 2011 attributable
to personnel costs related to the continued build-out of certain
businesses, technology costs as well as increases in default-