Bank of America 2011 Annual Report Download - page 150
Download and view the complete annual report
Please find page 150 of the 2011 Bank of America annual report below. You can navigate through the pages in the report by either clicking on the pages listed below, or by using the keyword search tool below to find specific information within the annual report.-
 1
1 -
2
-
3
-
4
-
5
-
6
-
7
-
8
-
9
-
10
-
11
-
12
-
13
-
14
-
15
-
16
-
17
-
18
-
19
-
20
-
21
-
22
-
23
-
24
-
25
-
26
-
27
-
28
-
29
-
30
-
31
-
32
-
33
-
34
-
35
-
36
-
37
-
38
-
39
-
40
-
41
-
42
-
43
-
44
-
45
-
46
-
47
-
48
-
49
-
50
-
51
-
52
-
53
-
54
-
55
-
56
-
57
-
58
-
59
-
60
-
61
-
62
-
63
-
64
-
65
-
66
-
67
-
68
-
69
-
70
-
71
-
72
-
73
-
74
-
75
-
76
-
77
-
78
-
79
-
80
-
81
-
82
-
83
-
84
-
85
-
86
-
87
-
88
-
89
-
90
-
91
-
92
-
93
-
94
-
95
-
96
-
97
-
98
-
99
-
100
-
101
-
102
-
103
-
104
-
105
-
106
-
107
-
108
-
109
-
110
-
111
-
112
-
113
-
114
-
115
-
116
-
117
-
118
-
119
-
120
-
121
-
122
-
123
-
124
-
125
-
126
-
127
-
128
-
129
-
130
-
131
-
132
-
133
-
134
-
135
-
136
-
137
-
138
-
139
-
 140
140 -
 141
141 -
 142
142 -
 143
143 -
 144
144 -
 145
145 -
 146
146 -
 147
147 -
 148
148 -
 149
149 -
 150
150 -
 151
151 -
 152
152 -
 153
153 -
 154
154 -
 155
155 -
 156
156 -
 157
157 -
 158
158 -
 159
159 -
 160
160 -
161
-
162
-
163
-
164
-
165
-
166
-
167
-
168
-
169
-
170
-
171
-
172
-
173
-
174
-
175
-
176
-
177
-
178
-
179
-
180
-
181
-
182
-
183
-
184
-
185
-
186
-
187
-
188
-
189
-
190
-
191
-
192
-
193
-
194
-
195
-
196
-
197
-
198
-
199
-
200
-
201
-
202
-
203
-
204
-
205
-
206
-
207
-
208
-
209
-
210
-
211
-
212
-
213
-
214
-
215
-
216
-
217
-
218
-
219
-
220
-
221
-
222
-
223
-
224
-
225
-
226
-
227
-
228
-
229
-
230
-
231
-
232
-
233
-
234
-
235
-
236
-
237
-
238
-
239
-
240
-
241
-
242
-
243
-
244
-
245
-
246
-
247
-
248
-
249
-
250
-
251
-
252
-
253
-
254
-
255
-
256
-
257
-
258
-
259
-
260
-
261
-
262
-
263
-
264
-
265
-
266
-
267
-
268
-
269
-
270
-
271
-
272
-
273
-
274
-
275
-
276
 |
 |

148 Bank of America 2011
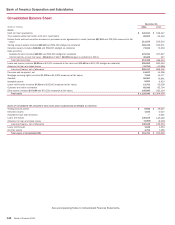
Bank of America Corporation and Subsidiaries
Consolidated Balance Sheet
(Dollars in millions)
Assets
Cash and cash equivalents
Time deposits placed and other short-term investments
Federal funds sold and securities borrowed or purchased under agreements to resell (includes $87,453 and $78,599 measured at fair
value)
Trading account assets (includes $80,130 and $89,165 pledged as collateral)
Derivative assets (includes $58,891 and $58,297 pledged as collateral)
Debt securities:
Available-for-sale (includes $69,021 and $99,925 pledged as collateral)
Held-to-maturity, at cost (fair value - $35,442 and $427; $24,009 pledged as collateral in 2011)
Total debt securities
Loans and leases (includes $8,804 and $3,321 measured at fair value and $73,463 and $91,730 pledged as collateral)
Allowance for loan and lease losses
Loans and leases, net of allowance
Premises and equipment, net
Mortgage servicing rights (includes $7,378 and $14,900 measured at fair value)
Goodwill
Intangible assets
Loans held-for-sale (includes $7,630 and $25,942 measured at fair value)
Customer and other receivables
Other assets (includes $37,084 and $70,531 measured at fair value)
Total assets
Assets of consolidated VIEs included in total assets above (substantially all pledged as collateral)
Trading account assets
Derivative assets
Available-for-sale debt securities
Loans and leases
Allowance for loan and lease losses
Loans and leases, net of allowance
Loans held-for-sale
All other assets
Total assets of consolidated VIEs
December 31
2011
$ 120,102
26,004
211,183
169,319
73,023
276,151
35,265
311,416
926,200
(33,783)
892,417
13,637
7,510
69,967
8,021
13,762
66,999
145,686
$2,129,046
$ 8,595
1,634
—
140,194
(5,066)
135,128
1,635
4,769
$ 151,761
2010
$ 108,427
26,433
209,616
194,671
73,000
337,627
427
338,054
940,440
(41,885)
898,555
14,306
15,177
73,861
9,923
35,058
85,704
182,124
$ 2,264,909
$ 19,627
2,027
2,601
145,469
(8,935)
136,534
1,953
7,086
$169,828
See accompanying Notes to Consolidated Financial Statements.