Bank of America 2011 Annual Report Download - page 104
Download and view the complete annual report
Please find page 104 of the 2011 Bank of America annual report below. You can navigate through the pages in the report by either clicking on the pages listed below, or by using the keyword search tool below to find specific information within the annual report.-
 1
1 -
2
-
3
-
4
-
5
-
6
-
7
-
8
-
9
-
10
-
11
-
12
-
13
-
14
-
15
-
16
-
17
-
18
-
19
-
20
-
21
-
22
-
23
-
24
-
25
-
26
-
27
-
28
-
29
-
30
-
31
-
32
-
33
-
34
-
35
-
36
-
37
-
38
-
39
-
40
-
41
-
42
-
43
-
44
-
45
-
46
-
47
-
48
-
49
-
50
-
51
-
52
-
53
-
54
-
55
-
56
-
57
-
58
-
59
-
60
-
61
-
62
-
63
-
64
-
65
-
66
-
67
-
68
-
69
-
70
-
71
-
72
-
73
-
74
-
75
-
76
-
77
-
78
-
79
-
80
-
81
-
82
-
83
-
84
-
85
-
86
-
87
-
88
-
89
-
90
-
91
-
92
-
93
-
 94
94 -
 95
95 -
 96
96 -
 97
97 -
 98
98 -
 99
99 -
 100
100 -
 101
101 -
 102
102 -
 103
103 -
 104
104 -
 105
105 -
 106
106 -
 107
107 -
 108
108 -
 109
109 -
 110
110 -
 111
111 -
 112
112 -
 113
113 -
 114
114 -
115
-
116
-
117
-
118
-
119
-
120
-
121
-
122
-
123
-
124
-
125
-
126
-
127
-
128
-
129
-
130
-
131
-
132
-
133
-
134
-
135
-
136
-
137
-
138
-
139
-
140
-
141
-
142
-
143
-
144
-
145
-
146
-
147
-
148
-
149
-
150
-
151
-
152
-
153
-
154
-
155
-
156
-
157
-
158
-
159
-
160
-
161
-
162
-
163
-
164
-
165
-
166
-
167
-
168
-
169
-
170
-
171
-
172
-
173
-
174
-
175
-
176
-
177
-
178
-
179
-
180
-
181
-
182
-
183
-
184
-
185
-
186
-
187
-
188
-
189
-
190
-
191
-
192
-
193
-
194
-
195
-
196
-
197
-
198
-
199
-
200
-
201
-
202
-
203
-
204
-
205
-
206
-
207
-
208
-
209
-
210
-
211
-
212
-
213
-
214
-
215
-
216
-
217
-
218
-
219
-
220
-
221
-
222
-
223
-
224
-
225
-
226
-
227
-
228
-
229
-
230
-
231
-
232
-
233
-
234
-
235
-
236
-
237
-
238
-
239
-
240
-
241
-
242
-
243
-
244
-
245
-
246
-
247
-
248
-
249
-
250
-
251
-
252
-
253
-
254
-
255
-
256
-
257
-
258
-
259
-
260
-
261
-
262
-
263
-
264
-
265
-
266
-
267
-
268
-
269
-
270
-
271
-
272
-
273
-
274
-
275
-
276
 |
 |

102 Bank of America 2011
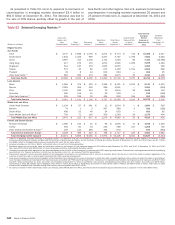
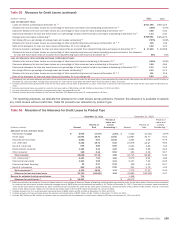
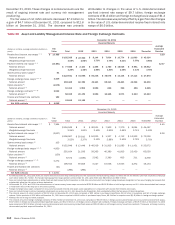
Table 54
(Dollars in millions)
Greece
Sovereign
Financial Institutions
Corporates
Total Greece
Ireland
Sovereign
Financial Institutions
Corporates
Total Ireland
Italy
Sovereign
Financial Institutions
Corporates
Total Italy
Portugal
Sovereign
Financial Institutions
Corporates
Total Portugal
Spain
Sovereign
Financial Institutions
Corporates
Total Spain
Total
Sovereign
Financial Institutions
Corporates
Total selected European
exposure
Selected European Countries
Funded Loans
and Loan
Equivalents (1)
$1
—
322
$ 323
$18
120
1,235
$ 1,373
$—
2,077
1,560
$ 3,637
$—
34
159
$ 193
$74
459
1,586
$ 2,119
$93
2,690
4,862
$ 7,645
Unfunded
Loan
Commitments
$—
—
97
$97
$—
20
154
$ 174
$—
76
1,813
$ 1,889
$—
—
73
$73
$6
7
871
$ 884
$6
103
3,008
$ 3,117
Derivative
Assets (2)
$—
3
33
$36
$12
173
100
$ 285
$ 1,542
139
541
$ 2,222
$41
2
21
$64
$71
143
112
$ 326
$ 1,666
460
807
$ 2,933
Securities/
Other
Investments (3)
$34
10
7
$51
$24
470
57
$ 551
$29
83
259
$ 371
$—
35
15
$50
$2
487
121
$ 610
$89
1,085
459
$ 1,633
Country
Exposure at
December 31,
2011
$35
13
459
$ 507
$54
783
1,546
$ 2,383
$ 1,571
2,375
4,173
$ 8,119
$41
71
268
$ 380
$ 153
1,096
2,690
$ 3,939
$ 1,854
4,338
9,136
$ 15,328
Hedges and
Credit Default
Protection (4)
$(6)
(19)
(25)
$ (50)
$(1)
(33)
(35)
$ (69)
$ (1,399)
(705)
(1,181)
$ (3,285)
$ (50)
(80)
(207)
$ (337)
$ (146)
(138)
(835)
$ (1,119)
$ (1,602)
(975)
(2,283)
$ (4,860)
Net Country
Exposure at
December 31,
2011 (5)
$29
(6)
434
$457
$53
750
1,511
$ 2,314
$172
1,670
2,992
$ 4,834
$(9)
(9)
61
$43
$7
958
1,855
$ 2,820
$252
3,363
6,853
$10,468
Increase
(Decrease) from
December 31,
2010(
$ (69)
(31)
62
$ (38)
$ (357)
(36)
(474)
$ (867)
$ 206
(567)
790
$ 429
$49
(354)
19
$ (286)
$ 332
(958)
(588)
$ (1,214)
$ 161
(1,946)
(191)
$ (1,976)
(1) Includes loans, leases, overdrafts, acceptances, due froms, SBLCs, commercial letters of credit and formal guarantees, which have not been reduced by collateral, hedges or credit default protection.
Previously classified local exposures are no longer offset by local liabilities, which totaled $939 million at December 31, 2011. Of the $939 million previously applied for exposure reduction, $562
million was in Ireland, $217 million in Italy, $126 million in Spain and $34 million in Greece.
(2) Derivative assets are carried at fair value and have been reduced by the amount of cash collateral applied of $3.5 billion at December 31, 2011. At December 31, 2011, there was $83 million of
other marketable securities collateralizing derivative assets. Derivative assets have not been reduced by hedges or credit default protection.
(3) Includes $369 million in notional value of reverse repurchase agreements, which are presented based on the domicile of the counterparty consistent with FFIEC reporting requirements. Cross-border
resale agreements where the underlying collateral is U.S. Treasury securities are excluded from this presentation. Securities exposures are reduced by hedges and short positions on a single-name
basis to, but not less than zero.
(4) Represents the fair value of credit default protection purchased, including $(3.4) billion in net credit default protection purchased to hedge loans and securities, $(1.4) billion in additional credit
default protection to hedge derivative assets and $(74) million in other short positions.
(5) Represents country exposure less the fair value of hedges and credit default protection.
Provision for Credit Losses
The provision for credit losses decreased $15.0 billion to $13.4
billion for 2011 compared to 2010. The provision for credit losses
was $7.4 billion lower than net charge-offs for 2011, resulting in
a reduction in the allowance for credit losses driven primarily by
lower delinquencies, improved collection rates and fewer
bankruptcy filings across the Card Services portfolio, and
improvement in overall credit quality in the commercial real estate
portfolio partially offset by additions to consumer PCI loan portfolio
reserves. This compared to a $5.9 billion reduction in the
allowance for credit losses in 2010.
The provision for credit losses for the consumer portfolio
decreased $11.1 billion to $14.3 billion for 2011 compared to
2010 reflecting improving economic conditions and improvement
in the current and projected levels of delinquencies, collections
and bankruptcies in the U.S. consumer credit card and unsecured
consumer lending portfolios. Also contributing to the decrease
were lower credit costs in the non-PCI home equity loan portfolio
due to improving portfolio trends, partially offset by higher credit
costs in the residential mortgage portfolio primarily reflecting
further deterioration in home prices. For the consumer PCI loan
portfolios, updates to our expected cash flows resulted in an
increase in reserves of $2.2 billion in 2011 due primarily to our
updated home price outlook. Reserve increases related to the
consumer PCI loan portfolios in 2010 were also $2.2 billion.
The provision for credit losses for the commercial portfolio,
including the provision for unfunded lending commitments,
decreased $3.9 billion to a benefit of $915 million in 2011
compared to 2010 due to continued economic improvement and
the resulting impact on property values in the commercial real
estate portfolio, lower current and projected levels of
delinquencies and bankruptcies in the U.S. small business
commercial portfolio and improvement in borrower credit profiles
across the remainder of the commercial portfolio.