Bank of America 2011 Annual Report Download - page 73
Download and view the complete annual report
Please find page 73 of the 2011 Bank of America annual report below. You can navigate through the pages in the report by either clicking on the pages listed below, or by using the keyword search tool below to find specific information within the annual report.-
 1
1 -
2
-
3
-
4
-
5
-
6
-
7
-
8
-
9
-
10
-
11
-
12
-
13
-
14
-
15
-
16
-
17
-
18
-
19
-
20
-
21
-
22
-
23
-
24
-
25
-
26
-
27
-
28
-
29
-
30
-
31
-
32
-
33
-
34
-
35
-
36
-
37
-
38
-
39
-
40
-
41
-
42
-
43
-
44
-
45
-
46
-
47
-
48
-
49
-
50
-
51
-
52
-
53
-
54
-
55
-
56
-
57
-
58
-
59
-
60
-
61
-
62
-
 63
63 -
 64
64 -
 65
65 -
 66
66 -
 67
67 -
 68
68 -
 69
69 -
 70
70 -
 71
71 -
 72
72 -
 73
73 -
 74
74 -
 75
75 -
 76
76 -
 77
77 -
 78
78 -
 79
79 -
 80
80 -
 81
81 -
 82
82 -
 83
83 -
84
-
85
-
86
-
87
-
88
-
89
-
90
-
91
-
92
-
93
-
94
-
95
-
96
-
97
-
98
-
99
-
100
-
101
-
102
-
103
-
104
-
105
-
106
-
107
-
108
-
109
-
110
-
111
-
112
-
113
-
114
-
115
-
116
-
117
-
118
-
119
-
120
-
121
-
122
-
123
-
124
-
125
-
126
-
127
-
128
-
129
-
130
-
131
-
132
-
133
-
134
-
135
-
136
-
137
-
138
-
139
-
140
-
141
-
142
-
143
-
144
-
145
-
146
-
147
-
148
-
149
-
150
-
151
-
152
-
153
-
154
-
155
-
156
-
157
-
158
-
159
-
160
-
161
-
162
-
163
-
164
-
165
-
166
-
167
-
168
-
169
-
170
-
171
-
172
-
173
-
174
-
175
-
176
-
177
-
178
-
179
-
180
-
181
-
182
-
183
-
184
-
185
-
186
-
187
-
188
-
189
-
190
-
191
-
192
-
193
-
194
-
195
-
196
-
197
-
198
-
199
-
200
-
201
-
202
-
203
-
204
-
205
-
206
-
207
-
208
-
209
-
210
-
211
-
212
-
213
-
214
-
215
-
216
-
217
-
218
-
219
-
220
-
221
-
222
-
223
-
224
-
225
-
226
-
227
-
228
-
229
-
230
-
231
-
232
-
233
-
234
-
235
-
236
-
237
-
238
-
239
-
240
-
241
-
242
-
243
-
244
-
245
-
246
-
247
-
248
-
249
-
250
-
251
-
252
-
253
-
254
-
255
-
256
-
257
-
258
-
259
-
260
-
261
-
262
-
263
-
264
-
265
-
266
-
267
-
268
-
269
-
270
-
271
-
272
-
273
-
274
-
275
-
276
 |
 |

Bank of America 2011 71
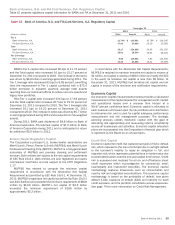
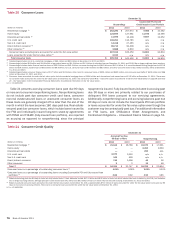
Our Global Excess Liquidity Sources increased $42 billion to
$378 billion compared to December 31, 2010 and were
maintained as presented in Table 17. This increase was due
primarily to liquidity generated by our bank subsidiaries through
deposit growth, reductions in LHFS and other factors. Partially
offsetting the increase were the results of our ongoing reductions
of our debt footprint announced in 2010.
Table 17
(Dollars in billions)
Parent company
Bank subsidiaries
Broker/dealers
Total global excess liquidity sources
Global Excess Liquidity Sources
December 31
2011
$ 125
222
31
$ 378
2010
$ 121
180
35
$ 336
Average for
Three Months
Ended
December 31,
2011
$ 118
215
29
$ 362
As shown in Table 17, the Global Excess Liquidity Sources
available to the parent company totaled $125 billion and $121
billion at December 31, 2011 and 2010. Typically, parent company
cash is deposited overnight with BANA.
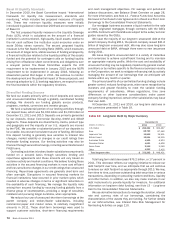
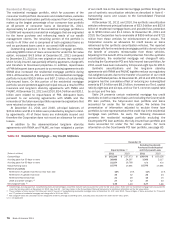
Table 18 presents the composition of Global Excess Liquidity
Sources at December 31, 2011 and 2010.
Table 18
(Dollars in billions)
Cash on deposit
U.S. treasuries
U.S. agency securities and mortgage-backed securities
Non-U.S. government and supranational securities
Total global excess liquidity sources
Global Excess Liquidity Sources Composition
December 31
2011
$79
48
228
23
$ 378
2010
$80
65
174
17
$ 336
Global Excess Liquidity Sources available to our bank
subsidiaries at December 31, 2011 and 2010 totaled $222 billion
and $180 billion. These amounts are distinct from the cash
deposited by the parent company presented in Table 17. In addition
to their Global Excess Liquidity Sources, our bank subsidiaries
hold significant amounts of other unencumbered securities that
we believe could also be used to generate liquidity, primarily
investment-grade MBS. Our bank subsidiaries can also generate
incremental liquidity by pledging a range of other unencumbered
loans and securities to certain Federal Home Loan Banks (FHLBs)
and the Federal Reserve Discount Window. The cash we could have
obtained by borrowing against this pool of specifically-identified
eligible assets was approximately $189 billion and $170 billion
at December 31, 2011 and 2010. We have established
operational procedures to enable us to borrow against these
assets, including regularly monitoring our total pool of eligible
loans and securities collateral. Due to regulatory restrictions,
liquidity generated by the bank subsidiaries can only be used to
fund obligations within the bank subsidiaries and can only be
transferred to the parent company or non-bank subsidiaries with
prior regulatory approval.
Global Excess Liquidity Sources available to our broker/dealer
subsidiaries at December 31, 2011 and 2010 totaled $31 billion
and $35 billion. Our broker/dealers also held significant amounts
of other unencumbered securities that we believe could also be
used to generate additional liquidity, including investment-grade
securities and equities. Liquidity held in a broker/dealer subsidiary
is only available to meet the obligations of that entity and can only
be transferred to the parent company or to any other subsidiary
with prior regulatory approval due to regulatory restrictions and
minimum requirements.
Time to Required Funding and Stress Modeling
We use a variety of metrics to determine the appropriate amounts
of excess liquidity to maintain at the parent company and our bank
and broker/dealer subsidiaries. One metric we use to evaluate the
appropriate level of excess liquidity at the parent company is “Time
to Required Funding.” This debt coverage measure indicates the
number of months that the parent company can continue to meet
its unsecured contractual obligations as they come due using only
its Global Excess Liquidity Sources without issuing any new debt
or accessing any additional liquidity sources. We define unsecured
contractual obligations for purposes of this metric as maturities
of senior or subordinated debt issued or guaranteed by Bank of
America Corporation or Merrill Lynch. These include certain
unsecured debt instruments, primarily structured liabilities, which
we may be required to settle for cash prior to maturity and
issuances under the FDIC’s Temporary Liquidity Guarantee
Program (TLGP), all of which will mature by June 30, 2012. The
Corporation has established a target for Time to Required Funding
of 21 months. Our Time to Required Funding at December 31,
2011 was 29 months. For purposes of calculating Time to Required
Funding for December 31, 2011, we have also included in the
amount of unsecured contractual obligations the $8.6 billion
liability related to the BNY Mellon Settlement. This settlement is
subject to final court approval and certain other conditions, and
the timing of the payment is not certain.
We utilize liquidity stress models to assist us in determining
the appropriate amounts of excess liquidity to maintain at the
parent company and our bank and broker/dealer subsidiaries.
These models are risk sensitive and have become increasingly
important in analyzing our potential contractual and contingent
cash outflows beyond those outflows considered in the Time to
Required Funding analysis.
We evaluate the liquidity requirements under a range of
scenarios with varying levels of severity and time horizons. These
scenarios incorporate market-wide and Corporation-specific
events, including potential credit ratings downgrades for the parent
company and our subsidiaries. We consider and utilize scenarios
based on historical experience, regulatory guidance, and both
expected and unexpected future events.
The types of contractual and contingent cash outflows we
consider in our scenarios may include, but are not limited to,
upcoming contractual maturities of unsecured debt and reductions
in new debt issuance; diminished access to secured financing
markets; potential deposit withdrawals and reduced rollover of
maturing term deposits by customers; increased draws on loan
commitment and liquidity facilities, including Variable Rate
Demand Notes; additional collateral that counterparties could call
if our credit ratings were further downgraded; collateral, margin
and subsidiary capital requirements arising from losses; and
potential liquidity required to maintain businesses and finance
customer activities.
We consider all sources of funds that we could access during
each stress scenario and focus particularly on matching available
sources with corresponding liquidity requirements by legal entity.
We also use the stress modeling results to manage our asset-
liability profile and establish limits and guidelines on certain
funding sources and businesses.