Bank of America 2011 Annual Report Download - page 259
Download and view the complete annual report
Please find page 259 of the 2011 Bank of America annual report below. You can navigate through the pages in the report by either clicking on the pages listed below, or by using the keyword search tool below to find specific information within the annual report.-
 1
1 -
2
-
3
-
4
-
5
-
6
-
7
-
8
-
9
-
10
-
11
-
12
-
13
-
14
-
15
-
16
-
17
-
18
-
19
-
20
-
21
-
22
-
23
-
24
-
25
-
26
-
27
-
28
-
29
-
30
-
31
-
32
-
33
-
34
-
35
-
36
-
37
-
38
-
39
-
40
-
41
-
42
-
43
-
44
-
45
-
46
-
47
-
48
-
49
-
50
-
51
-
52
-
53
-
54
-
55
-
56
-
57
-
58
-
59
-
60
-
61
-
62
-
63
-
64
-
65
-
66
-
67
-
68
-
69
-
70
-
71
-
72
-
73
-
74
-
75
-
76
-
77
-
78
-
79
-
80
-
81
-
82
-
83
-
84
-
85
-
86
-
87
-
88
-
89
-
90
-
91
-
92
-
93
-
94
-
95
-
96
-
97
-
98
-
99
-
100
-
101
-
102
-
103
-
104
-
105
-
106
-
107
-
108
-
109
-
110
-
111
-
112
-
113
-
114
-
115
-
116
-
117
-
118
-
119
-
120
-
121
-
122
-
123
-
124
-
125
-
126
-
127
-
128
-
129
-
130
-
131
-
132
-
133
-
134
-
135
-
136
-
137
-
138
-
139
-
140
-
141
-
142
-
143
-
144
-
145
-
146
-
147
-
148
-
149
-
150
-
151
-
152
-
153
-
154
-
155
-
156
-
157
-
158
-
159
-
160
-
161
-
162
-
163
-
164
-
165
-
166
-
167
-
168
-
169
-
170
-
171
-
172
-
173
-
174
-
175
-
176
-
177
-
178
-
179
-
180
-
181
-
182
-
183
-
184
-
185
-
186
-
187
-
188
-
189
-
190
-
191
-
192
-
193
-
194
-
195
-
196
-
197
-
198
-
199
-
200
-
201
-
202
-
203
-
204
-
205
-
206
-
207
-
208
-
209
-
210
-
211
-
212
-
213
-
214
-
215
-
216
-
217
-
218
-
219
-
220
-
221
-
222
-
223
-
224
-
225
-
226
-
227
-
228
-
229
-
230
-
231
-
232
-
233
-
234
-
235
-
236
-
237
-
238
-
239
-
240
-
241
-
242
-
243
-
244
-
245
-
246
-
247
-
248
-
 249
249 -
 250
250 -
 251
251 -
 252
252 -
 253
253 -
 254
254 -
 255
255 -
 256
256 -
 257
257 -
 258
258 -
 259
259 -
 260
260 -
 261
261 -
 262
262 -
 263
263 -
 264
264 -
 265
265 -
 266
266 -
 267
267 -
 268
268 -
 269
269 -
270
-
271
-
272
-
273
-
274
-
275
-
276
 |
 |

Bank of America 2011 257
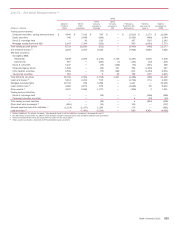
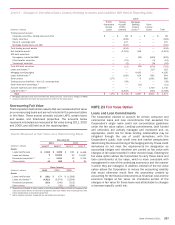
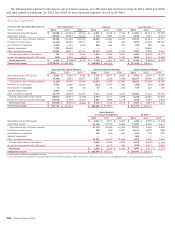
Level 3 – Changes in Unrealized Gains (Losses) Relating to Assets and Liabilities Still Held at Reporting Date
(Dollars in millions)
Trading account assets:
Corporate securities, trading loans and other
Equity securities
Non-U.S. sovereign debt
Mortgage trading loans and ABS
Total trading account assets
Net derivative assets
AFS debt securities:
Non-agency residential MBS
Other taxable securities
Tax-exempt securities
Total AFS debt securities
Loans and leases (2)
Mortgage servicing rights
Loans held-for-sale (2)
Other assets
Trading account liabilities – Non-U.S. sovereign debt
Other short-term borrowings (2)
Accrued expenses and other liabilities (2)
Long-term debt (2)
Total
2009
Equity
Investment
Income
(Loss)
$—
—
—
—
—
—
—
—
—
—
—
—
—
(177)
—
—
—
—
$ (177)
Trading
Account
Profits
(Losses)
$89
(328)
137
(332)
(434)
(2,761)
—
(11)
(2)
(13)
—
—
(195)
—
(38)
—
—
(2,303)
$ (5,744)
Mortgage
Banking
Income
(Loss) (1)
$—
—
—
—
—
348
(20)
—
—
(20)
—
4,100
164
6
—
(11)
—
—
$ 4,587
Other
Income
(Loss)
$—
—
—
—
—
—
(659)
(3)
(8)
(670)
210
—
695
1,061
—
—
1,740
(225)
$ 2,811
Total
$89
(328)
137
(332)
(434)
(2,413)
(679)
(14)
(10)
(703)
210
4,100
664
890
(38)
(11)
1,740
(2,528)
$ 1,477
(1) Mortgage banking income does not reflect the impact of Level 1 and Level 2 hedges on MSRs.
(2) Amounts represent items that are accounted for under the fair value option.
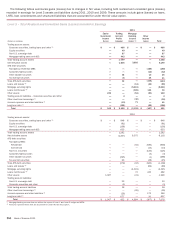
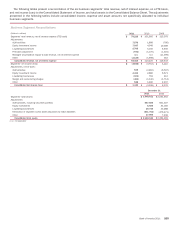
Nonrecurring Fair Value
The Corporation held certain assets that are measured at fair value
on a nonrecurring basis and are not included in the previous tables
in this Note. These assets primarily include LHFS, certain loans
and leases, and foreclosed properties. The amounts below
represent only balances measured at fair value during 2011, 2010
and 2009, and still held as of the reporting date.
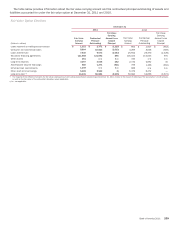
Assets Measured at Fair Value on a Nonrecurring Basis
(Dollars in millions)
Assets
Loans held-for-sale
Loans and leases
Foreclosed properties (1)
Other assets
December 31
2011
Level 2
$ 2,662
9
—
44
Level 3
$ 1,008
10,629
2,531
885
2010
Level 2
$ 931
23
10
8
Level 3
$ 6,408
11,917
2,125
95
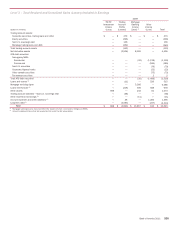
(Dollars in millions)
Assets
Loans held-for-sale
Loans and leases (2)
Foreclosed properties
Other assets
Gains (Losses)
2011
$ (181)
(4,813)
(333)
—
2010
$ 174
(6,074)
(240)
(50)
2009
$ (1,288)
(5,596)
(322)
(268)
(1) Amounts are included in other assets on the Consolidated Balance Sheet and represent fair
value and related losses on foreclosed properties that were written down subsequent to their
initial classification as foreclosed properties.
(2) Gains (losses) represent charge-offs on real estate-secured loans.
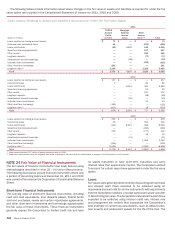
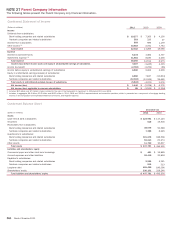
NOTE 23 Fair Value Option
Loans and Loan Commitments
The Corporation elected to account for certain consumer and
commercial loans and loan commitments that exceeded the
Corporation’s single name credit risk concentration guidelines
under the fair value option. Lending commitments, both funded
and unfunded, are actively managed and monitored and, as
appropriate, credit risk for these lending relationships may be
mitigated through the use of credit derivatives, with the
Corporation’s public side credit view and market perspectives
determining the size and timing of the hedging activity. These credit
derivatives do not meet the requirements for designation as
accounting hedges and therefore are carried at fair value with
changes in fair value recorded in other income (loss). Electing the
fair value option allows the Corporation to carry these loans and
loan commitments at fair value, which is more consistent with
management’s view of the underlying economics and the manner
in which they are managed. In addition, election of the fair value
option allows the Corporation to reduce the accounting volatility
that would otherwise result from the asymmetry created by
accounting for the financial instruments at historical cost and the
economic hedges at fair value. An immaterial portion of the
changes in fair value for these loans was attributable to changes
in borrower-specific credit risk.