Bank of America 2011 Annual Report Download - page 263
Download and view the complete annual report
Please find page 263 of the 2011 Bank of America annual report below. You can navigate through the pages in the report by either clicking on the pages listed below, or by using the keyword search tool below to find specific information within the annual report.-
 1
1 -
2
-
3
-
4
-
5
-
6
-
7
-
8
-
9
-
10
-
11
-
12
-
13
-
14
-
15
-
16
-
17
-
18
-
19
-
20
-
21
-
22
-
23
-
24
-
25
-
26
-
27
-
28
-
29
-
30
-
31
-
32
-
33
-
34
-
35
-
36
-
37
-
38
-
39
-
40
-
41
-
42
-
43
-
44
-
45
-
46
-
47
-
48
-
49
-
50
-
51
-
52
-
53
-
54
-
55
-
56
-
57
-
58
-
59
-
60
-
61
-
62
-
63
-
64
-
65
-
66
-
67
-
68
-
69
-
70
-
71
-
72
-
73
-
74
-
75
-
76
-
77
-
78
-
79
-
80
-
81
-
82
-
83
-
84
-
85
-
86
-
87
-
88
-
89
-
90
-
91
-
92
-
93
-
94
-
95
-
96
-
97
-
98
-
99
-
100
-
101
-
102
-
103
-
104
-
105
-
106
-
107
-
108
-
109
-
110
-
111
-
112
-
113
-
114
-
115
-
116
-
117
-
118
-
119
-
120
-
121
-
122
-
123
-
124
-
125
-
126
-
127
-
128
-
129
-
130
-
131
-
132
-
133
-
134
-
135
-
136
-
137
-
138
-
139
-
140
-
141
-
142
-
143
-
144
-
145
-
146
-
147
-
148
-
149
-
150
-
151
-
152
-
153
-
154
-
155
-
156
-
157
-
158
-
159
-
160
-
161
-
162
-
163
-
164
-
165
-
166
-
167
-
168
-
169
-
170
-
171
-
172
-
173
-
174
-
175
-
176
-
177
-
178
-
179
-
180
-
181
-
182
-
183
-
184
-
185
-
186
-
187
-
188
-
189
-
190
-
191
-
192
-
193
-
194
-
195
-
196
-
197
-
198
-
199
-
200
-
201
-
202
-
203
-
204
-
205
-
206
-
207
-
208
-
209
-
210
-
211
-
212
-
213
-
214
-
215
-
216
-
217
-
218
-
219
-
220
-
221
-
222
-
223
-
224
-
225
-
226
-
227
-
228
-
229
-
230
-
231
-
232
-
233
-
234
-
235
-
236
-
237
-
238
-
239
-
240
-
241
-
242
-
243
-
244
-
245
-
246
-
247
-
248
-
249
-
250
-
251
-
252
-
 253
253 -
 254
254 -
 255
255 -
 256
256 -
 257
257 -
 258
258 -
 259
259 -
 260
260 -
 261
261 -
 262
262 -
 263
263 -
 264
264 -
 265
265 -
 266
266 -
 267
267 -
 268
268 -
 269
269 -
 270
270 -
 271
271 -
 272
272 -
 273
273 -
274
-
275
-
276
 |
 |

Bank of America 2011 261
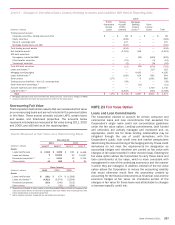
carrying value of loans is presented net of the applicable allowance
for loan losses and excludes leases. The Corporation elected to
account for certain large corporate loans that exceeded the
Corporation’s single name credit risk concentration guidelines
under the fair value option.
Deposits
The fair value for certain deposits with stated maturities was
determined by discounting contractual cash flows using current
market rates for instruments with similar maturities. The carrying
value of non-U.S. time deposits approximates fair value. For
deposits with no stated maturities, the carrying value was
considered to approximate fair value and does not take into
account the significant value of the cost advantage and stability
of the Corporation’s long-term relationships with depositors. The
Corporation accounts for certain long-term fixed-rate deposits that
are economically hedged with derivatives under the fair value
option.
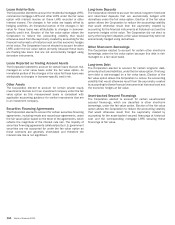
Long-term Debt
The Corporation uses quoted market prices, when available, to
estimate fair value for its long-term debt. When quoted market
prices are not available, fair value is estimated based on current
market interest rates and credit spreads for debt with similar terms
and maturities. The Corporation accounts for certain structured
liabilities under the fair value option.
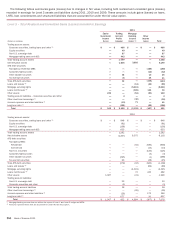
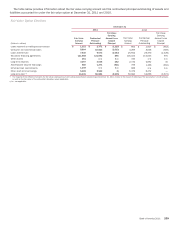
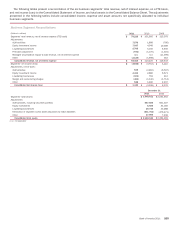
Fair Value of Financial Instruments
The carrying values and fair values of certain financial instruments
where only a portion of the ending balance at December 31, 2011
and 2010 was carried at fair value are presented in the table below.
Fair Value of Financial Instruments
(Dollars in millions)
Financial assets
Held-to-maturity debt
securities
Loans
Financial liabilities
Deposits
Long-term debt
December 31
2011
Carrying
Value
$ 35,265
870,520
1,033,041
372,265
Fair
Value
$ 35,442
843,392
1,033,248
343,211
2010
Carrying
Value
$ 427
876,739
1,010,430
448,431
Fair
Value
$ 427
861,695
1,010,460
441,672
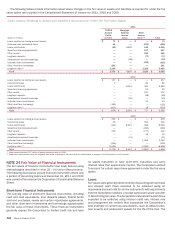
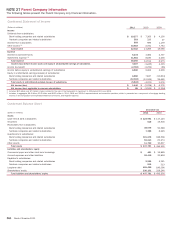
NOTE 25 Mortgage Servicing Rights
The Corporation accounts for consumer MSRs at fair value with
changes in fair value recorded in the Consolidated Statement of
Income in mortgage banking income (loss). The Corporation
economically hedges these MSRs with certain derivatives and
securities including MBS and U.S. Treasuries. The securities that
economically hedge the MSRs are classified in other assets with
changes in the fair value of the securities and the related interest
income recorded in mortgage banking income (loss).
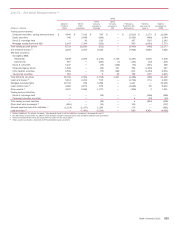
The table below presents activity for residential first-lien MSRs
for 2011 and 2010. Commercial and residential reverse MSRs,
which are carried at the lower of carrying or market value and
accounted for using the amortization method, totaled $132 million
and $277 million at December 31, 2011 and 2010, and are not
included in the tables in this Note.
(Dollars in millions)
Balance, January 1
Additions
Sales
Impact of customer payments (1)
Impact of changes in interest rates and other market
factors (2)
Model and other cash flow assumption changes: (3)
Projected cash flows, primarily due to increases in
cost to service loans
Impact of changes in the Home Price Index
Impact of changes in the prepayment model
Other model changes
Balance, December 31
Mortgage loans serviced for investors (in billions)
2011
$ 14,900
1,656
(896)
(2,621)
(4,890)
(2,306)
428
1,818
(711)
$ 7,378
$ 1,379
2010
$ 19,465
3,626
(110)
(3,760)
(3,224)
(3,161)
937
1,298
(171)
$ 14,900
$ 1,628
(1) Represents the change in the market value of the MSR asset due to the impact of customer
payments received during the period.
(2) These amounts reflect changes in the modeled MSR fair value largely due to observed changes
in interest rates, volatility, spreads and the shape of the forward swap curve.
(3) These amounts reflect periodic adjustments to the valuation model as well as changes in certain
cash flow assumptions such as costs to service and ancillary income per loan.
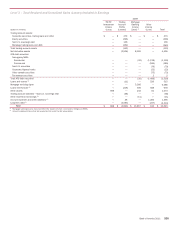
The Corporation uses an OAS valuation approach which factors
in prepayment risk to determine the fair value of MSRs. This
approach consists of projecting servicing cash flows under multiple
interest rate scenarios and discounting these cash flows using
risk-adjusted discount rates. The significant economic
assumptions used in determining the fair value of MSRs at
December 31, 2011 and 2010 are presented below.
Significant Economic Assumptions
(Dollars in millions)
Weighted-average OAS
Weighted-average life, in years
December 31
2011
Fixed
2.80%
3.78
Adjustable
5.61%
2.10
2010
Fixed
2.17%
4.85
Adjustable
5.12%
2.29