Bank of America 2011 Annual Report Download - page 74
Download and view the complete annual report
Please find page 74 of the 2011 Bank of America annual report below. You can navigate through the pages in the report by either clicking on the pages listed below, or by using the keyword search tool below to find specific information within the annual report.-
 1
1 -
2
-
3
-
4
-
5
-
6
-
7
-
8
-
9
-
10
-
11
-
12
-
13
-
14
-
15
-
16
-
17
-
18
-
19
-
20
-
21
-
22
-
23
-
24
-
25
-
26
-
27
-
28
-
29
-
30
-
31
-
32
-
33
-
34
-
35
-
36
-
37
-
38
-
39
-
40
-
41
-
42
-
43
-
44
-
45
-
46
-
47
-
48
-
49
-
50
-
51
-
52
-
53
-
54
-
55
-
56
-
57
-
58
-
59
-
60
-
61
-
62
-
63
-
 64
64 -
 65
65 -
 66
66 -
 67
67 -
 68
68 -
 69
69 -
 70
70 -
 71
71 -
 72
72 -
 73
73 -
 74
74 -
 75
75 -
 76
76 -
 77
77 -
 78
78 -
 79
79 -
 80
80 -
 81
81 -
 82
82 -
 83
83 -
 84
84 -
85
-
86
-
87
-
88
-
89
-
90
-
91
-
92
-
93
-
94
-
95
-
96
-
97
-
98
-
99
-
100
-
101
-
102
-
103
-
104
-
105
-
106
-
107
-
108
-
109
-
110
-
111
-
112
-
113
-
114
-
115
-
116
-
117
-
118
-
119
-
120
-
121
-
122
-
123
-
124
-
125
-
126
-
127
-
128
-
129
-
130
-
131
-
132
-
133
-
134
-
135
-
136
-
137
-
138
-
139
-
140
-
141
-
142
-
143
-
144
-
145
-
146
-
147
-
148
-
149
-
150
-
151
-
152
-
153
-
154
-
155
-
156
-
157
-
158
-
159
-
160
-
161
-
162
-
163
-
164
-
165
-
166
-
167
-
168
-
169
-
170
-
171
-
172
-
173
-
174
-
175
-
176
-
177
-
178
-
179
-
180
-
181
-
182
-
183
-
184
-
185
-
186
-
187
-
188
-
189
-
190
-
191
-
192
-
193
-
194
-
195
-
196
-
197
-
198
-
199
-
200
-
201
-
202
-
203
-
204
-
205
-
206
-
207
-
208
-
209
-
210
-
211
-
212
-
213
-
214
-
215
-
216
-
217
-
218
-
219
-
220
-
221
-
222
-
223
-
224
-
225
-
226
-
227
-
228
-
229
-
230
-
231
-
232
-
233
-
234
-
235
-
236
-
237
-
238
-
239
-
240
-
241
-
242
-
243
-
244
-
245
-
246
-
247
-
248
-
249
-
250
-
251
-
252
-
253
-
254
-
255
-
256
-
257
-
258
-
259
-
260
-
261
-
262
-
263
-
264
-
265
-
266
-
267
-
268
-
269
-
270
-
271
-
272
-
273
-
274
-
275
-
276
 |
 |

72 Bank of America 2011
Basel III Liquidity Standards
In December 2010, the Basel Committee issued “International
framework for liquidity risk measurement, standards and
monitoring,” which includes two proposed measures of liquidity
risk. These two minimum liquidity measures were initially
introduced in guidance in December 2009 and are considered part
of Basel III.
The first proposed liquidity measure is the Liquidity Coverage
Ratio (LCR), which is calculated as the amount of a financial
institution’s unencumbered, high-quality, liquid assets relative to
the net cash outflows the institution could encounter under an
acute 30-day stress scenario. The second proposed liquidity
measure is the Net Stable Funding Ratio (NSFR), which measures
the amount of longer-term, stable sources of funding employed by
a financial institution relative to the liquidity profiles of the assets
funded and the potential for contingent calls on funding liquidity
arising from off-balance sheet commitments and obligations over
a one-year period. The Basel Committee expects the LCR
requirement to be implemented in January 2015 and the NSFR
requirement to be implemented in January 2018, following an
observation period that began in 2011. We continue to monitor
the development and the potential impact of these proposals, and
assuming adoption by U.S. banking regulators, we expect to meet
the final standards within the regulatory timelines.
Diversified Funding Sources
We fund our assets primarily with a mix of deposits and secured
and unsecured liabilities through a globally coordinated funding
strategy. We diversify our funding globally across products,
programs, markets, currencies and investor groups.
We fund a substantial portion of our lending activities through
our deposit base, which was $1,033 billion and $1,010 billion at
December 31, 2011 and 2010. Deposits are primarily generated
by our Deposits, Global Commercial Banking, GWIM and GBAM
segments. These deposits are diversified by clients, product type
and geography and the majority of our U.S. deposits are insured
by the FDIC. We consider a substantial portion of our deposits to
be a stable, low-cost and consistent source of funding. We believe
this deposit funding is generally less sensitive to interest rate
changes, market volatility or changes in our credit ratings than
wholesale funding sources. Our lending activities may also be
financed through secured borrowings, including securitizations and
FHLB loans.
Our trading activities in broker/dealer subsidiaries are primarily
funded on a secured basis through securities lending and
repurchase agreements and these amounts will vary based on
customer activity and market conditions. We believe funding these
activities in the secured financing markets is more cost efficient
and less sensitive to changes in our credit ratings than unsecured
financing. Repurchase agreements are generally short-term and
often overnight. Disruptions in secured financing markets for
financial institutions have occurred in prior market cycles which
resulted in adverse changes in terms or significant reductions in
the availability of such financing. We manage the liquidity risks
arising from secured funding by sourcing funding globally from a
diverse group of counterparties, providing a range of securities
collateral and pursuing longer durations, when appropriate.
We reduced our use of unsecured short-term borrowings at the
parent company and broker/dealer subsidiaries, including
commercial paper and master notes, to relatively insignificant
amounts in 2011. These short-term borrowings were used to
support customer activities, short-term financing requirements
and cash management objectives. For average and period-end
balance discussions, see Balance Sheet Overview on page 28.
For more information, see Note 12 – Federal Funds Sold, Securities
Borrowed or Purchased Under Agreements to Resell and Short-term
Borrowings to the Consolidated Financial Statements.
Our mortgage business accesses a liquid market for the sale
of newly originated mortgages through contracts with the GSEs
and FHA. Contracts with the GSEs are subject to the seller/servicer
guides issued by the GSEs.
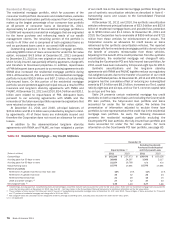
We issue the majority of our long-term unsecured debt at the
parent company. During 2011, the parent company issued $21.0
billion of long-term unsecured debt. We may also issue long-term
unsecured debt at BANA, although there were no new issuances
during 2011.
We issue long-term unsecured debt in a variety of maturities
and currencies to achieve cost-efficient funding and to maintain
an appropriate maturity profile. While the cost and availability of
unsecured funding may be negatively impacted by general market
conditions or by matters specific to the financial services industry
or the Corporation, we seek to mitigate refinancing risk by actively
managing the amount of our borrowings that we anticipate will
mature within any month or quarter.
The primary benefits of our centralized funding strategy include
greater control, reduced funding costs, wider name recognition by
investors and greater flexibility to meet the variable funding
requirements of subsidiaries. Where regulations, time zone
differences or other business considerations make parent
company funding impractical, certain other subsidiaries may issue
their own debt.
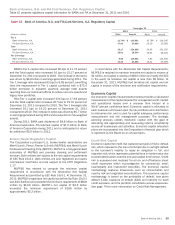
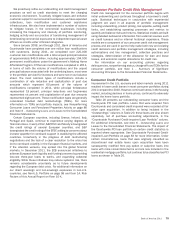
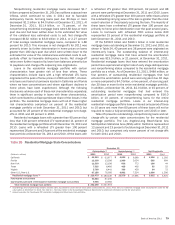
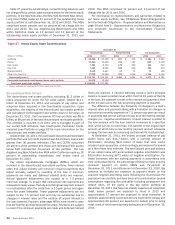
At December 31, 2011 and 2010, our long-term debt was in
the currencies presented in Table 19.
Table 19
(Dollars in millions)
U.S. Dollar
Euro
Japanese Yen
British Pound
Australian Dollar
Canadian Dollar
Swiss Franc
Other
Total long-term debt
Long-term Debt by Major Currency
December 31
2011
$ 255,262
68,799
19,568
12,554
4,900
4,621
2,268
4,293
$ 372,265
2010
$ 302,487
87,482
19,901
16,505
6,924
6,628
3,069
5,435
$ 448,431
Total long-term debt decreased $76.2 billion, or 17 percent in
2011. This decrease reflects our ongoing initiative to reduce our
debt footprint over time, and we anticipate that we will continue
to reduce our debt footprint as appropriate through 2013. We may,
from time to time, purchase outstanding debt securities in various
transactions, depending on prevailing market conditions, liquidity
and other factors. In addition, we also may make markets in our
debt instruments to provide liquidity for investors. For additional
information on long-term debt funding, see Note 13 – Long-term
Debt to the Consolidated Financial Statements.
We use derivative transactions to manage the duration, interest
rate and currency risks of our borrowings, considering the
characteristics of the assets they are funding. For further details
on our ALM activities, see Interest Rate Risk Management for
Nontrading Activities on page 110.