Bank of America 2011 Annual Report Download - page 103
Download and view the complete annual report
Please find page 103 of the 2011 Bank of America annual report below. You can navigate through the pages in the report by either clicking on the pages listed below, or by using the keyword search tool below to find specific information within the annual report.Bank of America 2011 101
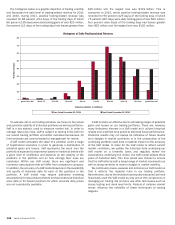
At December 31, 2011 and 2010, 60 percent and 70 percent
of our emerging markets exposure was in Asia Pacific. Emerging
markets exposure in Asia Pacific decreased by $8.5 billion driven
by a $19.0 billion decrease related to the sale of CCB shares,
partially offset by increases in loans and securities predominately
in India, China (excluding CCB) and South Korea.
At December 31, 2011 and 2010, 26 percent and 21 percent
of our emerging markets exposure was in Latin America. Latin
America emerging markets exposure increased $2.5 billion driven
by increases in securities and local exposure in Brazil.
At December 31, 2011 and 2010, eight percent and six percent
of our emerging markets exposure was in Middle East and Africa,
with an increase of $926 million primarily driven by increases in
loans and derivatives in United Arab Emirates, and by increases
in loans in Other Middle East and Africa. At December 31, 2011
and 2010, six percent and three percent of the emerging markets
exposure was in Central and Eastern Europe, with the increase
driven by an increase in loans in the Russian Federation.
Certain European countries, including Greece, Ireland, Italy,
Portugal and Spain, have experienced varying degrees of financial
stress. Risks from the continued debt crisis in Europe could
continue to disrupt the financial markets which could have a
detrimental impact on global economic conditions and sovereign
and non-sovereign debt in these countries. Uncertainty in the
progress of debt restructuring negotiations and the lack of a clear
resolution to the crisis have led to continued volatility in European
financial markets, as well as global financial markets. In December
2011, the ECB announced initiatives to address European bank
liquidity and funding concerns by providing low-cost, three-year
loans to banks, and expanding collateral eligibility. In early 2012,
S&P, Fitch and Moody’s downgraded the credit ratings of several
European countries, and S&P downgraded the credit rating of the
EFSF, adding to concerns about investor appetite for continued
support in stabilizing the affected countries.
Table 54 shows our direct sovereign and non-sovereign
exposures, excluding consumer credit card exposure, in these
countries at December 31, 2011. Our total sovereign and non-
sovereign exposure to these countries was $15.3 billion at
December 31, 2011 compared to $16.6 billion at December 31,
2010. The total exposure to these countries, net of hedges, was
$10.5 billion at December 31, 2011 compared to $12.4 billion at
December 31, 2010, of which $252 million and $91 million was
total sovereign exposure. At December 31, 2011 and 2010, the
fair value of net credit default protection purchased was $4.9
billion and $4.2 billion.
We hedge certain of our selected European country exposure
with credit default protection in the form of CDS. The majority of
our CDS contracts are with highly-rated financial institutions
primarily outside of the Eurozone and we work to limit or eliminate
correlated CDS. Due to our engagement in market-making
activities, our CDS portfolio contains contracts with various
maturities to a diverse set of counterparties.
In addition to our direct sovereign and non-sovereign exposures,
a significant deterioration of the European debt crisis could result
in material reductions in the value of sovereign debt and other
asset classes, disruptions in capital markets, widening of credit
spreads, loss of investor confidence in the financial services
industry, a slowdown in global economic activity and other adverse
developments. For additional information on the debt crisis in
Europe, see Item 1A. Risk Factors of this Annual Report on Form
10-K.
Losses could still result even if there is credit default protection
purchased because the purchased credit protection contracts only
pay out under certain scenarios and thus not all losses may be
covered by the credit protection contracts. The effectiveness of
our CDS protection as a hedge of these risks is influenced by a
number of factors, including the contractual terms of the CDS.
Generally, only the occurrence of a credit event as defined by the
CDS terms (which may include, among other events, the failure to
pay by, or restructuring of, the reference entity) results in a payment
under the purchased credit protection contracts. The
determination as to whether a credit event has occurred is made
by the relevant International Swaps and Derivatives Association,
Inc. (ISDA) Determination Committee (comprised of various ISDA
member firms) based on the terms of the CDS and facts and
circumstances for the event. Accordingly, uncertainties exist as to
whether any particular strategy or policy action for addressing
European debt crisis would constitute a credit event under the
CDS. A voluntary restructuring may not trigger a credit event under
CDS terms and consequently may not trigger a payment under the
CDS contract.


