Bank of America 2011 Annual Report Download - page 250
Download and view the complete annual report
Please find page 250 of the 2011 Bank of America annual report below. You can navigate through the pages in the report by either clicking on the pages listed below, or by using the keyword search tool below to find specific information within the annual report.-
 1
1 -
2
-
3
-
4
-
5
-
6
-
7
-
8
-
9
-
10
-
11
-
12
-
13
-
14
-
15
-
16
-
17
-
18
-
19
-
20
-
21
-
22
-
23
-
24
-
25
-
26
-
27
-
28
-
29
-
30
-
31
-
32
-
33
-
34
-
35
-
36
-
37
-
38
-
39
-
40
-
41
-
42
-
43
-
44
-
45
-
46
-
47
-
48
-
49
-
50
-
51
-
52
-
53
-
54
-
55
-
56
-
57
-
58
-
59
-
60
-
61
-
62
-
63
-
64
-
65
-
66
-
67
-
68
-
69
-
70
-
71
-
72
-
73
-
74
-
75
-
76
-
77
-
78
-
79
-
80
-
81
-
82
-
83
-
84
-
85
-
86
-
87
-
88
-
89
-
90
-
91
-
92
-
93
-
94
-
95
-
96
-
97
-
98
-
99
-
100
-
101
-
102
-
103
-
104
-
105
-
106
-
107
-
108
-
109
-
110
-
111
-
112
-
113
-
114
-
115
-
116
-
117
-
118
-
119
-
120
-
121
-
122
-
123
-
124
-
125
-
126
-
127
-
128
-
129
-
130
-
131
-
132
-
133
-
134
-
135
-
136
-
137
-
138
-
139
-
140
-
141
-
142
-
143
-
144
-
145
-
146
-
147
-
148
-
149
-
150
-
151
-
152
-
153
-
154
-
155
-
156
-
157
-
158
-
159
-
160
-
161
-
162
-
163
-
164
-
165
-
166
-
167
-
168
-
169
-
170
-
171
-
172
-
173
-
174
-
175
-
176
-
177
-
178
-
179
-
180
-
181
-
182
-
183
-
184
-
185
-
186
-
187
-
188
-
189
-
190
-
191
-
192
-
193
-
194
-
195
-
196
-
197
-
198
-
199
-
200
-
201
-
202
-
203
-
204
-
205
-
206
-
207
-
208
-
209
-
210
-
211
-
212
-
213
-
214
-
215
-
216
-
217
-
218
-
219
-
220
-
221
-
222
-
223
-
224
-
225
-
226
-
227
-
228
-
229
-
230
-
231
-
232
-
233
-
234
-
235
-
236
-
237
-
238
-
239
-
 240
240 -
 241
241 -
 242
242 -
 243
243 -
 244
244 -
 245
245 -
 246
246 -
 247
247 -
 248
248 -
 249
249 -
 250
250 -
 251
251 -
 252
252 -
 253
253 -
 254
254 -
 255
255 -
 256
256 -
 257
257 -
 258
258 -
 259
259 -
 260
260 -
261
-
262
-
263
-
264
-
265
-
266
-
267
-
268
-
269
-
270
-
271
-
272
-
273
-
274
-
275
-
276
 |
 |
248 Bank of America 2011
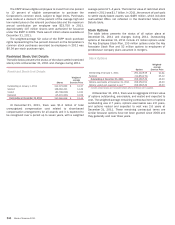
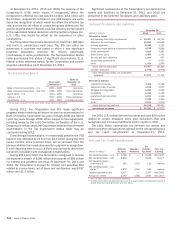
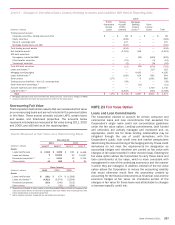
Mortgage Servicing Rights
The fair values of MSRs are determined using models that rely on
estimates of prepayment rates, the resultant weighted-average
lives of the MSRs and the OAS levels. For more information on
MSRs, see Note 25 – Mortgage Servicing Rights.
Loans Held-for-Sale
The fair values of LHFS are based on quoted market prices, where
available, or are determined by discounting estimated cash flows
using interest rates approximating the Corporation’s current
origination rates for similar loans adjusted to reflect the inherent
credit risk.
Other Assets
The fair values of AFS marketable equity securities are generally
based on quoted market prices or market prices for similar assets.
However, non-public investments are initially valued at the
transaction price and subsequently adjusted when evidence is
available to support such adjustments.
Securities Financing Agreements
The fair values of certain reverse repurchase agreements,
repurchase agreements and securities borrowed transactions are
determined using quantitative models, including discounted cash
flow models that require the use of multiple market inputs including
interest rates and spreads to generate continuous yield or pricing
curves, and volatility factors. The majority of market inputs are
actively quoted and can be validated through external sources,
including brokers, market transactions and third-party pricing
services.
Deposits and Other Short-term Borrowings
The fair values of deposits and other short-term borrowings are
determined using quantitative models, including discounted cash
flow models that require the use of multiple market inputs including
interest rates and spreads to generate continuous yield or pricing
curves, and volatility factors. The majority of market inputs are
actively quoted and can be validated through external sources,
including brokers, market transactions and third-party pricing
services. The Corporation considers the impact of its own credit
spreads in the valuation of these liabilities. The credit risk is
determined by reference to observable credit spreads in the
secondary cash market.
Long-term Debt
The Corporation issues structured liabilities that have coupons or
repayment terms linked to the performance of debt or equity
securities, indices, currencies or commodities. The fair values of
these structured liabilities are estimated using valuation models
for the combined derivative and debt portions of the notes. These
models incorporate observable and, in some instances,
unobservable inputs including security prices, interest rate yield
curves, option volatility, currency, commodity or equity rates and
correlations between these inputs. The Corporation considers the
impact of its own credit spreads in the valuation of these liabilities.
The credit risk is determined by reference to observable credit
spreads in the secondary bond market.
Asset-backed Secured Financings
The fair values of asset-backed secured financings are based on
external broker bids, where available, or are determined by
discounting estimated cash flows using interest rates
approximating the Corporation’s current origination rates for
similar loans adjusted to reflect the inherent credit risk.