Bank of America 2011 Annual Report Download - page 131
Download and view the complete annual report
Please find page 131 of the 2011 Bank of America annual report below. You can navigate through the pages in the report by either clicking on the pages listed below, or by using the keyword search tool below to find specific information within the annual report.-
 1
1 -
2
-
3
-
4
-
5
-
6
-
7
-
8
-
9
-
10
-
11
-
12
-
13
-
14
-
15
-
16
-
17
-
18
-
19
-
20
-
21
-
22
-
23
-
24
-
25
-
26
-
27
-
28
-
29
-
30
-
31
-
32
-
33
-
34
-
35
-
36
-
37
-
38
-
39
-
40
-
41
-
42
-
43
-
44
-
45
-
46
-
47
-
48
-
49
-
50
-
51
-
52
-
53
-
54
-
55
-
56
-
57
-
58
-
59
-
60
-
61
-
62
-
63
-
64
-
65
-
66
-
67
-
68
-
69
-
70
-
71
-
72
-
73
-
74
-
75
-
76
-
77
-
78
-
79
-
80
-
81
-
82
-
83
-
84
-
85
-
86
-
87
-
88
-
89
-
90
-
91
-
92
-
93
-
94
-
95
-
96
-
97
-
98
-
99
-
100
-
101
-
102
-
103
-
104
-
105
-
106
-
107
-
108
-
109
-
110
-
111
-
112
-
113
-
114
-
115
-
116
-
117
-
118
-
119
-
120
-
 121
121 -
 122
122 -
 123
123 -
 124
124 -
 125
125 -
 126
126 -
 127
127 -
 128
128 -
 129
129 -
 130
130 -
 131
131 -
 132
132 -
 133
133 -
 134
134 -
 135
135 -
 136
136 -
 137
137 -
 138
138 -
 139
139 -
 140
140 -
 141
141 -
142
-
143
-
144
-
145
-
146
-
147
-
148
-
149
-
150
-
151
-
152
-
153
-
154
-
155
-
156
-
157
-
158
-
159
-
160
-
161
-
162
-
163
-
164
-
165
-
166
-
167
-
168
-
169
-
170
-
171
-
172
-
173
-
174
-
175
-
176
-
177
-
178
-
179
-
180
-
181
-
182
-
183
-
184
-
185
-
186
-
187
-
188
-
189
-
190
-
191
-
192
-
193
-
194
-
195
-
196
-
197
-
198
-
199
-
200
-
201
-
202
-
203
-
204
-
205
-
206
-
207
-
208
-
209
-
210
-
211
-
212
-
213
-
214
-
215
-
216
-
217
-
218
-
219
-
220
-
221
-
222
-
223
-
224
-
225
-
226
-
227
-
228
-
229
-
230
-
231
-
232
-
233
-
234
-
235
-
236
-
237
-
238
-
239
-
240
-
241
-
242
-
243
-
244
-
245
-
246
-
247
-
248
-
249
-
250
-
251
-
252
-
253
-
254
-
255
-
256
-
257
-
258
-
259
-
260
-
261
-
262
-
263
-
264
-
265
-
266
-
267
-
268
-
269
-
270
-
271
-
272
-
273
-
274
-
275
-
276
 |
 |

Bank of America 2011 129
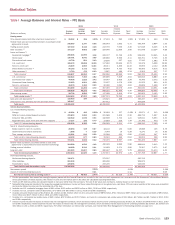
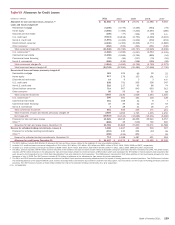
Table VII Allowance for Credit Losses
(Dollars in millions)
Allowance for loan and lease losses, January 1 (1)
Loans and leases charged off
Residential mortgage
Home equity
Discontinued real estate
U.S. credit card
Non-U.S. credit card
Direct/Indirect consumer
Other consumer
Total consumer charge-offs
U.S. commercial (2)
Commercial real estate
Commercial lease financing
Non-U.S. commercial
Total commercial charge-offs
Total loans and leases charged off
Recoveries of loans and leases previously charged off
Residential mortgage
Home equity
Discontinued real estate
U.S. credit card
Non-U.S. credit card
Direct/Indirect consumer
Other consumer
Total consumer recoveries
U.S. commercial (3)
Commercial real estate
Commercial lease financing
Non-U.S. commercial
Total commercial recoveries
Total recoveries of loans and leases previously charged off
Net charge-offs
Provision for loan and lease losses
Other (4)
Allowance for loan and lease losses, December 31
Reserve for unfunded lending commitments, January 1
Provision for unfunded lending commitments
Other (5)
Reserve for unfunded lending commitments, December 31
Allowance for credit losses, December 31
2011
$ 41,885
(4,195)
(4,990)
(106)
(8,114)
(1,691)
(2,190)
(252)
(21,538)
(1,690)
(1,298)
(61)
(155)
(3,204)
(24,742)
363
517
14
838
522
714
50
3,018
500
351
37
3
891
3,909
(20,833)
13,629
(898)
33,783
1,188
(219)
(255)
714
$ 34,497
2010
$ 47,988
(3,779)
(7,059)
(77)
(13,818)
(2,424)
(4,303)
(320)
(31,780)
(3,190)
(2,185)
(96)
(139)
(5,610)
(37,390)
109
278
9
791
217
967
59
2,430
391
168
39
28
626
3,056
(34,334)
28,195
36
41,885
1,487
240
(539)
1,188
$ 43,073
2009
$ 23,071
(4,436)
(7,205)
(104)
(6,753)
(1,332)
(6,406)
(491)
(26,727)
(5,237)
(2,744)
(217)
(558)
(8,756)
(35,483)
86
155
3
206
93
943
63
1,549
161
42
22
21
246
1,795
(33,688)
48,366
(549)
37,200
421
204
862
1,487
$ 38,687
2008
$ 11,588
(964)
(3,597)
(19)
(4,469)
(639)
(3,777)
(461)
(13,926)
(2,567)
(895)
(79)
(199)
(3,740)
(17,666)
39
101
3
308
88
663
62
1,264
118
8
19
26
171
1,435
(16,231)
26,922
792
23,071
518
(97)
—
421
$ 23,492
2007
$ 9,016
(78)
(286)
n/a
(3,410)
(453)
(1,885)
(346)
(6,458)
(1,135)
(54)
(55)
(28)
(1,272)
(7,730)
22
12
n/a
347
74
512
68
1,035
128
7
53
27
215
1,250
(6,480)
8,357
695
11,588
397
28
93
518
$ 12,106
(1) The 2010 balance includes $10.8 billion of allowance for loan and lease losses related to the adoption of new consolidation guidance.
(2) Includes U.S. small business commercial charge-offs of $1.1 billion, $2.0 billion, $3.0 billion, $2.0 billion and $931 million in 2011, 2010, 2009, 2008 and 2007, respectively.
(3) Includes U.S. small business commercial recoveries of $106 million, $107 million, $65 million, $39 million and $51 million in 2011, 2010, 2009, 2008 and 2007, respectively.
(4) The 2011 amount includes a $449 million reserve reduction in the allowance for loan and lease losses related to Canadian consumer card loans that were transferred to LHFS. The 2009 amount
includes a $750 million reduction in the allowance for loan and lease losses related to credit card loans of $8.5 billion which were exchanged for $7.8 billion in held-to-maturity debt securities that
were issued by the Corporation’s U.S. Credit Card Securitization Trust and retained by the Corporation. The 2008 amount includes the $1.2 billion addition to the Countrywide allowance for loan
losses as of July 1, 2008. The 2007 amount includes $750 million of additions to the allowance for loan losses for certain acquisitions.
(5) The 2011 and 2010 amounts primarily represent accretion of the Merrill Lynch purchase accounting adjustment and the impact of funding previously unfunded positions. The 2009 amount includes
the remaining balance of the acquired Merrill Lynch reserve excluding those commitments accounted for under the fair value option, net of accretion, and the impact of funding previously unfunded
positions. The 2007 amount includes a $124 million addition for reserve for unfunded lending commitments for a prior acquisition.
n/a = not applicable