Bank of America 2011 Annual Report Download - page 92
Download and view the complete annual report
Please find page 92 of the 2011 Bank of America annual report below. You can navigate through the pages in the report by either clicking on the pages listed below, or by using the keyword search tool below to find specific information within the annual report.-
 1
1 -
2
-
3
-
4
-
5
-
6
-
7
-
8
-
9
-
10
-
11
-
12
-
13
-
14
-
15
-
16
-
17
-
18
-
19
-
20
-
21
-
22
-
23
-
24
-
25
-
26
-
27
-
28
-
29
-
30
-
31
-
32
-
33
-
34
-
35
-
36
-
37
-
38
-
39
-
40
-
41
-
42
-
43
-
44
-
45
-
46
-
47
-
48
-
49
-
50
-
51
-
52
-
53
-
54
-
55
-
56
-
57
-
58
-
59
-
60
-
61
-
62
-
63
-
64
-
65
-
66
-
67
-
68
-
69
-
70
-
71
-
72
-
73
-
74
-
75
-
76
-
77
-
78
-
79
-
80
-
81
-
 82
82 -
 83
83 -
 84
84 -
 85
85 -
 86
86 -
 87
87 -
 88
88 -
 89
89 -
 90
90 -
 91
91 -
 92
92 -
 93
93 -
 94
94 -
 95
95 -
 96
96 -
 97
97 -
 98
98 -
 99
99 -
 100
100 -
 101
101 -
 102
102 -
103
-
104
-
105
-
106
-
107
-
108
-
109
-
110
-
111
-
112
-
113
-
114
-
115
-
116
-
117
-
118
-
119
-
120
-
121
-
122
-
123
-
124
-
125
-
126
-
127
-
128
-
129
-
130
-
131
-
132
-
133
-
134
-
135
-
136
-
137
-
138
-
139
-
140
-
141
-
142
-
143
-
144
-
145
-
146
-
147
-
148
-
149
-
150
-
151
-
152
-
153
-
154
-
155
-
156
-
157
-
158
-
159
-
160
-
161
-
162
-
163
-
164
-
165
-
166
-
167
-
168
-
169
-
170
-
171
-
172
-
173
-
174
-
175
-
176
-
177
-
178
-
179
-
180
-
181
-
182
-
183
-
184
-
185
-
186
-
187
-
188
-
189
-
190
-
191
-
192
-
193
-
194
-
195
-
196
-
197
-
198
-
199
-
200
-
201
-
202
-
203
-
204
-
205
-
206
-
207
-
208
-
209
-
210
-
211
-
212
-
213
-
214
-
215
-
216
-
217
-
218
-
219
-
220
-
221
-
222
-
223
-
224
-
225
-
226
-
227
-
228
-
229
-
230
-
231
-
232
-
233
-
234
-
235
-
236
-
237
-
238
-
239
-
240
-
241
-
242
-
243
-
244
-
245
-
246
-
247
-
248
-
249
-
250
-
251
-
252
-
253
-
254
-
255
-
256
-
257
-
258
-
259
-
260
-
261
-
262
-
263
-
264
-
265
-
266
-
267
-
268
-
269
-
270
-
271
-
272
-
273
-
274
-
275
-
276
 |
 |

90 Bank of America 2011
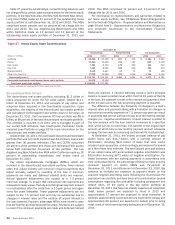
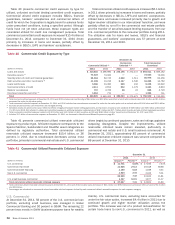
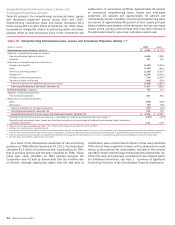
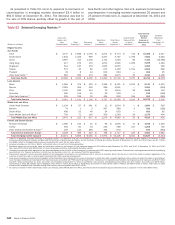
Table 40 presents commercial credit exposure by type for
utilized, unfunded and total binding committed credit exposure.
Commercial utilized credit exposure includes SBLCs, financial
guarantees, bankers’ acceptances and commercial letters of
credit for which the Corporation is legally bound to advance funds
under prescribed conditions, during a specified period. Although
funds have not yet been advanced, these exposure types are
considered utilized for credit risk management purposes. Total
commercial committed credit exposure increased $10.4 billion at
December 31, 2011 compared to December 31, 2010 driven
primarily by increases in loans and leases, partially offset by
decreases in SBLCs, LHFS and bankers’ acceptances.
Total commercial utilized credit exposure increased $6.1 billion
in 2011 driven primarily by increases in loans and leases, partially
offset by decreases in SBLCs, LHFS and bankers’ acceptances.
Utilized loans and leases increased primarily due to growth and
higher revolver utilization in our international franchise, and were
partially offset by run-off in the commercial real estate portfolio
and the transfer of securities-based lending exposures from our
U.S. commercial portfolio to the consumer portfolio during 2011.
The utilization rate for loans and leases, SBLCs and financial
guarantees, and bankers’ acceptances was 57 percent at both
December 31, 2011 and 2010.
Table 40
(Dollars in millions)
Loans and leases
Derivative assets (4)
Standby letters of credit and financial guarantees
Debt securities and other investments (5)
Loans held-for-sale
Commercial letters of credit
Bankers’ acceptances
Foreclosed properties and other (6)
Total
Commercial Credit Exposure by Type
December 31
Commercial Utilized (1)
2011
$ 316,816
73,023
55,384
11,108
5,006
2,411
797
1,964
$ 466,509
2010
$296,990
73,000
62,745
10,216
10,380
2,654
3,706
731
$460,422
Commercial
Unfunded (2, 3)
2011
$ 276,195
—
1,592
5,147
229
832
28
—
$ 284,023
2010
$272,172
—
1,511
4,546
242
1,179
23
—
$279,673
Total Commercial
Committed
2011
$ 593,011
73,023
56,976
16,255
5,235
3,243
825
1,964
$ 750,532
2010
$ 569,162
73,000
64,256
14,762
10,622
3,833
3,729
731
$ 740,095
(1) Total commercial utilized exposure at December 31, 2011 and 2010 includes loans outstanding of $6.6 billion and $3.3 billion and letters of credit with a notional value of $1.3 billion and $1.4 billion
accounted for under the fair value option.
(2) Total commercial unfunded exposure at December 31, 2011 and 2010 includes loan commitments accounted for under the fair value option with a notional value of $24.4 billion and $25.9 billion.
(3) Excludes unused business card lines which are not legally binding.
(4) Derivative assets are carried at fair value, reflect the effects of legally enforceable master netting agreements and have been reduced by cash collateral of $58.9 billion and $58.3 billion at December
31, 2011 and 2010. Not reflected in utilized and committed exposure is additional derivative collateral held of $16.1 billion and $17.7 billion which consists primarily of other marketable securities.
(5) Total commercial committed exposure consists of $16.3 billion and $14.2 billion of debt securities and $0 and $590 million of other investments at December 31, 2011 and 2010.
(6) Includes $1.3 billion of net monoline exposure at December 31, 2011, as discussed in Monoline and Related Exposure on page 95.
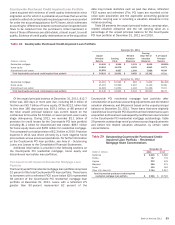
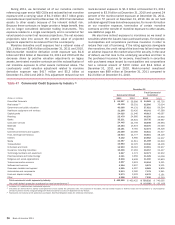
Table 41 presents commercial utilized reservable criticized
exposure by product type. Criticized exposure corresponds to the
Special Mention, Substandard and Doubtful asset categories as
defined by regulatory authorities. Total commercial utilized
reservable criticized exposure decreased $15.4 billion, or 36
percent, in 2011 due to broad-based decreases across most
portfolios, primarily in commercial real estate and U.S. commercial
driven largely by continued paydowns, sales and ratings upgrades
outpacing downgrades. Despite the improvements, utilized
reservable criticized levels remain elevated, particularly in
commercial real estate and U.S. small business commercial. At
December 31, 2011, approximately 85 percent of commercial
utilized reservable criticized exposure was secured compared to
88 percent at December 31, 2010.
Table 41
(Dollars in millions)
U.S. commercial
Commercial real estate
Commercial lease financing
Non-U.S. commercial
U.S. small business commercial
Total commercial utilized reservable criticized exposure
Commercial Utilized Reservable Criticized Exposure
December 31
2011
Amount (1)
$ 11,731
11,525
1,140
1,524
25,920
1,327
$ 27,247
Percent (2)
5.16%
27.13
5.18
2.44
7.32
10.01
7.41
2010
Amount (1)
$ 17,195
20,518
1,188
2,043
40,944
1,677
$ 42,621
Percent (2)
7.44%
38.88
5.41
5.01
11.81
11.37
11.80
(1) Total commercial utilized reservable criticized exposure at December 31, 2011 and 2010 includes loans and leases of $25.3 billion and $39.8 billion and commercial letters of credit of $1.9 billion
and $2.8 billion.
(2) Percentages are calculated as commercial utilized reservable criticized exposure divided by total commercial utilized reservable exposure for each exposure category.
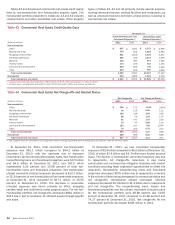
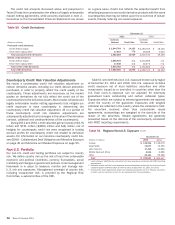
U.S. Commercial
At December 31, 2011, 58 percent of the U.S. commercial loan
portfolio, excluding small business, was managed in Global
Commercial Banking and 30 percent in GBAM. The remaining 12
percent was mostly in GWIM (business-purpose loans for wealthy
clients). U.S. commercial loans, excluding loans accounted for
under the fair value option, increased $4.4 billion in 2011 due to
continued growth and higher revolver utilization across the
portfolio. This increase was net of a product reclassification for
certain trade loans to non-U.S. commercial in 2011, as well as