Bank of America 2011 Annual Report Download - page 45
Download and view the complete annual report
Please find page 45 of the 2011 Bank of America annual report below. You can navigate through the pages in the report by either clicking on the pages listed below, or by using the keyword search tool below to find specific information within the annual report.-
 1
1 -
2
-
3
-
4
-
5
-
6
-
7
-
8
-
9
-
10
-
11
-
12
-
13
-
14
-
15
-
16
-
17
-
18
-
19
-
20
-
21
-
22
-
23
-
24
-
25
-
26
-
27
-
28
-
29
-
30
-
31
-
32
-
33
-
34
-
 35
35 -
 36
36 -
 37
37 -
 38
38 -
 39
39 -
 40
40 -
 41
41 -
 42
42 -
 43
43 -
 44
44 -
 45
45 -
 46
46 -
 47
47 -
 48
48 -
 49
49 -
 50
50 -
 51
51 -
 52
52 -
 53
53 -
 54
54 -
 55
55 -
56
-
57
-
58
-
59
-
60
-
61
-
62
-
63
-
64
-
65
-
66
-
67
-
68
-
69
-
70
-
71
-
72
-
73
-
74
-
75
-
76
-
77
-
78
-
79
-
80
-
81
-
82
-
83
-
84
-
85
-
86
-
87
-
88
-
89
-
90
-
91
-
92
-
93
-
94
-
95
-
96
-
97
-
98
-
99
-
100
-
101
-
102
-
103
-
104
-
105
-
106
-
107
-
108
-
109
-
110
-
111
-
112
-
113
-
114
-
115
-
116
-
117
-
118
-
119
-
120
-
121
-
122
-
123
-
124
-
125
-
126
-
127
-
128
-
129
-
130
-
131
-
132
-
133
-
134
-
135
-
136
-
137
-
138
-
139
-
140
-
141
-
142
-
143
-
144
-
145
-
146
-
147
-
148
-
149
-
150
-
151
-
152
-
153
-
154
-
155
-
156
-
157
-
158
-
159
-
160
-
161
-
162
-
163
-
164
-
165
-
166
-
167
-
168
-
169
-
170
-
171
-
172
-
173
-
174
-
175
-
176
-
177
-
178
-
179
-
180
-
181
-
182
-
183
-
184
-
185
-
186
-
187
-
188
-
189
-
190
-
191
-
192
-
193
-
194
-
195
-
196
-
197
-
198
-
199
-
200
-
201
-
202
-
203
-
204
-
205
-
206
-
207
-
208
-
209
-
210
-
211
-
212
-
213
-
214
-
215
-
216
-
217
-
218
-
219
-
220
-
221
-
222
-
223
-
224
-
225
-
226
-
227
-
228
-
229
-
230
-
231
-
232
-
233
-
234
-
235
-
236
-
237
-
238
-
239
-
240
-
241
-
242
-
243
-
244
-
245
-
246
-
247
-
248
-
249
-
250
-
251
-
252
-
253
-
254
-
255
-
256
-
257
-
258
-
259
-
260
-
261
-
262
-
263
-
264
-
265
-
266
-
267
-
268
-
269
-
270
-
271
-
272
-
273
-
274
-
275
-
276
 |
 |

Bank of America 2011 43
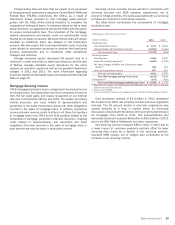
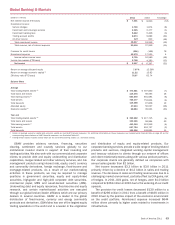
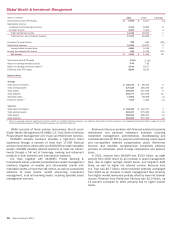
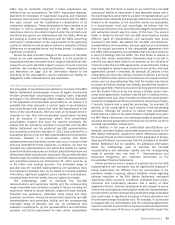
Global Banking & Markets
(Dollars in millions)
Net interest income (FTE basis)
Noninterest income:
Service charges
Investment and brokerage services
Investment banking fees
Trading account profits
All other income
Total noninterest income
Total revenue, net of interest expense
Provision for credit losses
Noninterest expense
Income before income taxes
Income tax expense (FTE basis)
Net income
Return on average allocated equity
Return on average economic capital (1)
Efficiency ratio (FTE basis)
Balance Sheet
Average
Total trading-related assets (2)
Total loans and leases
Total earning assets (2)
Total assets
Total deposits
Allocated equity
Economic capital (1)
Year end
Total trading-related assets (2)
Total loans and leases
Total earning assets (2)
Total assets
Total deposits
2011
$ 7,401
1,730
2,345
5,242
6,573
327
16,217
23,618
(296)
18,179
5,735
2,768
$ 2,967
7.97%
11.22
76.97
$ 473,861
116,075
563,870
725,177
116,088
37,233
26,583
$ 399,202
133,126
493,340
637,754
122,296
2010
$ 8,000
1,874
2,377
5,406
9,689
603
19,949
27,949
(166)
17,535
10,580
4,283
$ 6,297
12.58%
15.82
62.74
$ 507,830
98,593
601,084
753,844
97,858
50,037
39,931
$ 417,715
99,964
512,959
653,737
109,691
% Change
(7)%
(8)
(1)
(3)
(32)
(46)
(19)
(15)
78
4
(46)
(35)
(53)
(7)
18
(6)
(4)
19
(26)
(33)
(4)
33
(4)
(2)
11
(1) Return on average economic capital and economic capital are non-GAAP financial measures. For additional information on these measures, see Supplemental Financial Data on page 32 and for
corresponding reconciliations to GAAP financial measures, see Statistical Table XVI.
(2) Trading-related assets includes assets which are not considered earning assets (i.e., derivative assets).
GBAM provides advisory services, financing, securities
clearing, settlement and custody services globally to our
institutional investor clients in support of their investing and
trading activities. We also work with our commercial and corporate
clients to provide debt and equity underwriting and distribution
capabilities, merger-related and other advisory services, and risk
management products using interest rate, equity, credit, currency
and commodity derivatives, foreign exchange, fixed-income and
mortgage-related products. As a result of our market-making
activities in these products, we may be required to manage
positions in government securities, equity and equity-linked
securities, high-grade and high-yield corporate debt securities,
commercial paper, MBS and asset-backed securities (ABS).
Underwriting debt and equity issuances, fixed-income and equity
research, and certain market-based activities are executed
through our global broker/dealer affiliates which are our primary
dealers in several countries. GBAM is a leader in the global
distribution of fixed-income, currency and energy commodity
products and derivatives. GBAM also has one of the largest equity
trading operations in the world and is a leader in the origination
and distribution of equity and equity-related products. Our
corporate banking services provide a wide range of lending-related
products and services, integrated working capital management
and treasury solutions to clients through our network of offices
and client relationship teams along with various product partners.
Our corporate clients are generally defined as companies with
annual sales greater than $2 billion.
Net income decreased $3.3 billion to $3.0 billion in 2011
primarily driven by a decline of $4.2 billion in sales and trading
revenue. The decrease in sales and trading revenue was due to a
challenging market environment, partially offset by DVA gains, net
of hedges. In 2011, DVA gains, net of hedges, were $1.0 billion
compared to $262 million in 2010 due to the widening of our credit
spreads.
The provision for credit losses decreased $130 million to a
benefit of $296 million in 2011 from a benefit of $166 million in
2010 driven by the positive impact of the economic environment
on the credit portfolio. Noninterest expense increased $644
million driven primarily by higher costs related to investments in
infrastructure.