Bank of America 2011 Annual Report Download - page 91
Download and view the complete annual report
Please find page 91 of the 2011 Bank of America annual report below. You can navigate through the pages in the report by either clicking on the pages listed below, or by using the keyword search tool below to find specific information within the annual report.-
 1
1 -
2
-
3
-
4
-
5
-
6
-
7
-
8
-
9
-
10
-
11
-
12
-
13
-
14
-
15
-
16
-
17
-
18
-
19
-
20
-
21
-
22
-
23
-
24
-
25
-
26
-
27
-
28
-
29
-
30
-
31
-
32
-
33
-
34
-
35
-
36
-
37
-
38
-
39
-
40
-
41
-
42
-
43
-
44
-
45
-
46
-
47
-
48
-
49
-
50
-
51
-
52
-
53
-
54
-
55
-
56
-
57
-
58
-
59
-
60
-
61
-
62
-
63
-
64
-
65
-
66
-
67
-
68
-
69
-
70
-
71
-
72
-
73
-
74
-
75
-
76
-
77
-
78
-
79
-
80
-
 81
81 -
 82
82 -
 83
83 -
 84
84 -
 85
85 -
 86
86 -
 87
87 -
 88
88 -
 89
89 -
 90
90 -
 91
91 -
 92
92 -
 93
93 -
 94
94 -
 95
95 -
 96
96 -
 97
97 -
 98
98 -
 99
99 -
 100
100 -
 101
101 -
102
-
103
-
104
-
105
-
106
-
107
-
108
-
109
-
110
-
111
-
112
-
113
-
114
-
115
-
116
-
117
-
118
-
119
-
120
-
121
-
122
-
123
-
124
-
125
-
126
-
127
-
128
-
129
-
130
-
131
-
132
-
133
-
134
-
135
-
136
-
137
-
138
-
139
-
140
-
141
-
142
-
143
-
144
-
145
-
146
-
147
-
148
-
149
-
150
-
151
-
152
-
153
-
154
-
155
-
156
-
157
-
158
-
159
-
160
-
161
-
162
-
163
-
164
-
165
-
166
-
167
-
168
-
169
-
170
-
171
-
172
-
173
-
174
-
175
-
176
-
177
-
178
-
179
-
180
-
181
-
182
-
183
-
184
-
185
-
186
-
187
-
188
-
189
-
190
-
191
-
192
-
193
-
194
-
195
-
196
-
197
-
198
-
199
-
200
-
201
-
202
-
203
-
204
-
205
-
206
-
207
-
208
-
209
-
210
-
211
-
212
-
213
-
214
-
215
-
216
-
217
-
218
-
219
-
220
-
221
-
222
-
223
-
224
-
225
-
226
-
227
-
228
-
229
-
230
-
231
-
232
-
233
-
234
-
235
-
236
-
237
-
238
-
239
-
240
-
241
-
242
-
243
-
244
-
245
-
246
-
247
-
248
-
249
-
250
-
251
-
252
-
253
-
254
-
255
-
256
-
257
-
258
-
259
-
260
-
261
-
262
-
263
-
264
-
265
-
266
-
267
-
268
-
269
-
270
-
271
-
272
-
273
-
274
-
275
-
276
 |
 |

Bank of America 2011 89
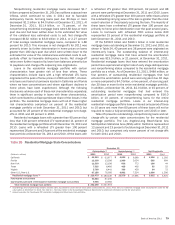
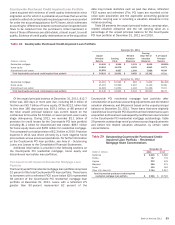
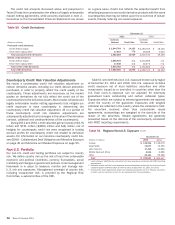
Reservable criticized balances, net charge-offs and
nonperforming loans, leases and foreclosed property balances in
the commercial credit portfolio declined in 2011. The reductions
in reservable criticized and nonperforming loans, leases and
foreclosed property were primarily in the commercial real estate
and U.S. commercial portfolios. Commercial real estate continued
to show improvement during 2011 compared to 2010 in both the
homebuilder and non-homebuilder portfolios. However, levels of
stressed commercial real estate loans remain elevated. The
reduction in reservable criticized U.S. commercial loans was driven
by broad-based improvements in terms of clients, industries and
businesses. Most other credit indicators across the remaining
commercial portfolios also improved.
Table 38 presents our commercial loans and leases, and
related credit quality information at December 31, 2011 and
2010.
Table 38
(Dollars in millions)
U.S. commercial
Commercial real estate (1)
Commercial lease financing
Non-U.S. commercial
U.S. small business commercial (2)
Commercial loans excluding loans accounted for under the fair value option
Loans accounted for under the fair value option (3)
Total commercial loans and leases
Commercial Loans and Leases
December 31
Outstandings
2011
$ 179,948
39,596
21,989
55,418
296,951
13,251
310,202
6,614
$ 316,816
2010
$175,586
49,393
21,942
32,029
278,950
14,719
293,669
3,321
$296,990
Nonperforming
2011
$ 2,174
3,880
26
143
6,223
114
6,337
73
$ 6,410
2010
$ 3,453
5,829
117
233
9,632
204
9,836
30
$ 9,866
Accruing Past Due
90 Days or More
2011
$75
7
14
—
96
216
312
—
$312
2010
$ 236
47
18
6
307
325
632
—
$ 632
(1) Includes U.S. commercial real estate loans of $37.8 billion and $46.9 billion and non-U.S. commercial real estate loans of $1.8 billion and $2.5 billion at December 31, 2011 and 2010.
(2) Includes card-related products.
(3) Commercial loans accounted for under the fair value option include U.S. commercial loans of $2.2 billion and $1.6 billion, non-U.S. commercial loans of $4.4 billion and $1.7 billion, and commercial
real estate loans of $0 and $79 million at December 31, 2011 and 2010. See Note 23 – Fair Value Option to the Consolidated Financial Statements for additional information on the fair value option.
Nonperforming commercial loans and leases as a percentage
of outstanding commercial loans and leases were 2.02 percent
and 3.32 percent (2.04 percent and 3.35 percent excluding loans
accounted for under the fair value option) at December 31, 2011
and 2010. Accruing commercial loans and leases past due 90
days or more as a percentage of outstanding commercial loans
and leases were 0.10 percent and 0.21 percent (0.10 percent
and 0.22 percent excluding loans accounted for under the fair
value option) at December 31, 2011 and 2010.
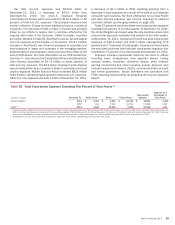
Table 39 presents net charge-offs and related ratios for our
commercial loans and leases for 2011 and 2010. Improving
portfolio trends drove lower charge-offs and higher recoveries
across most of the portfolio. Commercial real estate net charge-
offs during 2011 declined in both the homebuilder and non-
homebuilder portfolios. U.S. small business commercial net
charge-offs declined primarily due to improvements in
delinquencies, collections and bankruptcies. U.S. commercial
charge-offs decreased during 2011 due to broad-based declines
from improvements in client profiles, industries and businesses.
Table 39
(Dollars in millions)
U.S. commercial
Commercial real estate
Commercial lease financing
Non-U.S. commercial
U.S. small business commercial
Total commercial
Commercial Net Charge-offs and Related Ratios
Net Charge-offs
2011
$195
947
24
152
1,318
995
$ 2,313
2010
$ 881
2,017
57
111
3,066
1,918
$ 4,984
Net Charge-off Ratios (1)
2011
0.11%
2.13
0.11
0.36
0.46
7.12
0.77
2010
0.50%
3.37
0.27
0.39
1.07
12.00
1.64
(1) Net charge-off ratios are calculated as net charge-offs divided by average outstanding loans and leases excluding loans accounted for under the fair value option.