Bank of America 2011 Annual Report Download - page 36
Download and view the complete annual report
Please find page 36 of the 2011 Bank of America annual report below. You can navigate through the pages in the report by either clicking on the pages listed below, or by using the keyword search tool below to find specific information within the annual report.-
 1
1 -
2
-
3
-
4
-
5
-
6
-
7
-
8
-
9
-
10
-
11
-
12
-
13
-
14
-
15
-
16
-
17
-
18
-
19
-
20
-
21
-
22
-
23
-
24
-
25
-
 26
26 -
 27
27 -
 28
28 -
 29
29 -
 30
30 -
 31
31 -
 32
32 -
 33
33 -
 34
34 -
 35
35 -
 36
36 -
 37
37 -
 38
38 -
 39
39 -
 40
40 -
 41
41 -
 42
42 -
 43
43 -
 44
44 -
 45
45 -
 46
46 -
47
-
48
-
49
-
50
-
51
-
52
-
53
-
54
-
55
-
56
-
57
-
58
-
59
-
60
-
61
-
62
-
63
-
64
-
65
-
66
-
67
-
68
-
69
-
70
-
71
-
72
-
73
-
74
-
75
-
76
-
77
-
78
-
79
-
80
-
81
-
82
-
83
-
84
-
85
-
86
-
87
-
88
-
89
-
90
-
91
-
92
-
93
-
94
-
95
-
96
-
97
-
98
-
99
-
100
-
101
-
102
-
103
-
104
-
105
-
106
-
107
-
108
-
109
-
110
-
111
-
112
-
113
-
114
-
115
-
116
-
117
-
118
-
119
-
120
-
121
-
122
-
123
-
124
-
125
-
126
-
127
-
128
-
129
-
130
-
131
-
132
-
133
-
134
-
135
-
136
-
137
-
138
-
139
-
140
-
141
-
142
-
143
-
144
-
145
-
146
-
147
-
148
-
149
-
150
-
151
-
152
-
153
-
154
-
155
-
156
-
157
-
158
-
159
-
160
-
161
-
162
-
163
-
164
-
165
-
166
-
167
-
168
-
169
-
170
-
171
-
172
-
173
-
174
-
175
-
176
-
177
-
178
-
179
-
180
-
181
-
182
-
183
-
184
-
185
-
186
-
187
-
188
-
189
-
190
-
191
-
192
-
193
-
194
-
195
-
196
-
197
-
198
-
199
-
200
-
201
-
202
-
203
-
204
-
205
-
206
-
207
-
208
-
209
-
210
-
211
-
212
-
213
-
214
-
215
-
216
-
217
-
218
-
219
-
220
-
221
-
222
-
223
-
224
-
225
-
226
-
227
-
228
-
229
-
230
-
231
-
232
-
233
-
234
-
235
-
236
-
237
-
238
-
239
-
240
-
241
-
242
-
243
-
244
-
245
-
246
-
247
-
248
-
249
-
250
-
251
-
252
-
253
-
254
-
255
-
256
-
257
-
258
-
259
-
260
-
261
-
262
-
263
-
264
-
265
-
266
-
267
-
268
-
269
-
270
-
271
-
272
-
273
-
274
-
275
-
276
 |
 |

34 Bank of America 2011
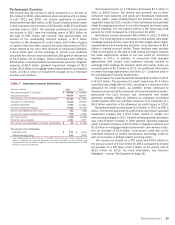
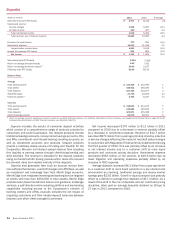
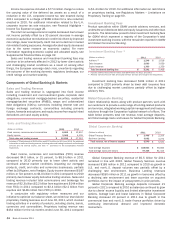
Deposits
(Dollars in millions)
Net interest income (FTE basis)
Noninterest income:
Service charges
All other income
Total noninterest income
Total revenue, net of interest expense
Provision for credit losses
Noninterest expense
Income before income taxes
Income tax expense (FTE basis)
Net income
Net interest yield (FTE basis)
Return on average allocated equity
Return on average economic capital (1)
Efficiency ratio (FTE basis)
Balance Sheet
Average
Total earning assets
Total assets
Total deposits
Allocated equity
Economic capital (1)
Year end
Total earning assets
Total assets
Total deposits
Client brokerage assets
2011
$ 8,471
3,995
223
4,218
12,689
173
10,633
1,883
691
$ 1,192
2.02%
5.02
20.66
83.80
$ 419,445
445,922
421,106
23,735
5,786
$ 418,623
445,680
421,871
66,576
2010
$ 8,278
5,057
227
5,284
13,562
201
11,196
2,165
803
$ 1,362
2.00%
5.62
21.97
82.55
$ 413,595
440,030
414,877
24,222
6,247
$ 414,215
440,954
415,189
63,597
% Change
2%
(21)
(2)
(20)
(6)
(14)
(5)
(13)
(14)
(12)
1
1
2
(2)
(7)
1
1
2
5
(1) Return on average economic capital and economic capital are non-GAAP financial measures. For additional information on these measures, see Supplemental Financial Data on page 32 and for
corresponding reconciliations to GAAP financial measures, see Statistical Table XVI.
Deposits includes the results of consumer deposit activities
which consist of a comprehensive range of products provided to
consumers and small businesses. Our deposit products include
traditional savings accounts, money market savings accounts, CDs
and IRAs, noninterest- and interest-bearing checking accounts, as
well as investment accounts and products. Deposit products
provide a relatively stable source of funding and liquidity for the
Corporation. We earn net interest spread revenue from investing
this liquidity in earning assets through client-facing lending and
ALM activities. The revenue is allocated to the deposit products
using our funds transfer pricing process which takes into account
the interest rates and implied maturity of the deposits.
Deposits also generates fees such as account service fees,
non-sufficient funds fees, overdraft charges and ATM fees, as well
as investment and brokerage fees from Merrill Edge accounts.
Merrill Edge is an integrated investing and banking service targeted
at clients with less than $250,000 in total assets. Merrill Edge
provides team-based investment advice and guidance, brokerage
services, a self-directed online investing platform and key banking
capabilities including access to the Corporation’s network of
banking centers and ATMs. Deposits includes the net impact of
migrating customers and their related deposit balances between
Deposits and other client-managed businesses.
Net income decreased $170 million to $1.2 billion in 2011
compared to 2010 due to a decrease in revenue partially offset
by a decrease in noninterest expense. Revenue of $12.7 billion
was down $873 million from a year ago primarily driven by a decline
in service charges reflecting the impact of overdraft policy changes
in conjunction with Regulation E that were fully implemented during
the third quarter of 2010. This was partially offset by an increase
in net interest income due to a customer shift to more liquid
products and continued pricing discipline. Noninterest expense
decreased $563 million, or five percent, to $10.6 billion due to
lower litigation and operating expenses partially offset by an
increase in FDIC expense.
Average deposits increased $6.2 billion from a year ago driven
by a customer shift to more liquid products in a low interest rate
environment as checking, traditional savings and money market
savings grew $23.6 billion. Growth in liquid products was partially
offset by a decline in average time deposits of $17.4 billion. As a
result of the shift in the mix of deposits and our continued pricing
discipline, rates paid on average deposits declined by 16 bps to
27 bps in 2011 compared to 2010.