Bank of America 2011 Annual Report Download - page 174
Download and view the complete annual report
Please find page 174 of the 2011 Bank of America annual report below. You can navigate through the pages in the report by either clicking on the pages listed below, or by using the keyword search tool below to find specific information within the annual report.-
 1
1 -
2
-
3
-
4
-
5
-
6
-
7
-
8
-
9
-
10
-
11
-
12
-
13
-
14
-
15
-
16
-
17
-
18
-
19
-
20
-
21
-
22
-
23
-
24
-
25
-
26
-
27
-
28
-
29
-
30
-
31
-
32
-
33
-
34
-
35
-
36
-
37
-
38
-
39
-
40
-
41
-
42
-
43
-
44
-
45
-
46
-
47
-
48
-
49
-
50
-
51
-
52
-
53
-
54
-
55
-
56
-
57
-
58
-
59
-
60
-
61
-
62
-
63
-
64
-
65
-
66
-
67
-
68
-
69
-
70
-
71
-
72
-
73
-
74
-
75
-
76
-
77
-
78
-
79
-
80
-
81
-
82
-
83
-
84
-
85
-
86
-
87
-
88
-
89
-
90
-
91
-
92
-
93
-
94
-
95
-
96
-
97
-
98
-
99
-
100
-
101
-
102
-
103
-
104
-
105
-
106
-
107
-
108
-
109
-
110
-
111
-
112
-
113
-
114
-
115
-
116
-
117
-
118
-
119
-
120
-
121
-
122
-
123
-
124
-
125
-
126
-
127
-
128
-
129
-
130
-
131
-
132
-
133
-
134
-
135
-
136
-
137
-
138
-
139
-
140
-
141
-
142
-
143
-
144
-
145
-
146
-
147
-
148
-
149
-
150
-
151
-
152
-
153
-
154
-
155
-
156
-
157
-
158
-
159
-
160
-
161
-
162
-
163
-
 164
164 -
 165
165 -
 166
166 -
 167
167 -
 168
168 -
 169
169 -
 170
170 -
 171
171 -
 172
172 -
 173
173 -
 174
174 -
 175
175 -
 176
176 -
 177
177 -
 178
178 -
 179
179 -
 180
180 -
 181
181 -
 182
182 -
 183
183 -
 184
184 -
185
-
186
-
187
-
188
-
189
-
190
-
191
-
192
-
193
-
194
-
195
-
196
-
197
-
198
-
199
-
200
-
201
-
202
-
203
-
204
-
205
-
206
-
207
-
208
-
209
-
210
-
211
-
212
-
213
-
214
-
215
-
216
-
217
-
218
-
219
-
220
-
221
-
222
-
223
-
224
-
225
-
226
-
227
-
228
-
229
-
230
-
231
-
232
-
233
-
234
-
235
-
236
-
237
-
238
-
239
-
240
-
241
-
242
-
243
-
244
-
245
-
246
-
247
-
248
-
249
-
250
-
251
-
252
-
253
-
254
-
255
-
256
-
257
-
258
-
259
-
260
-
261
-
262
-
263
-
264
-
265
-
266
-
267
-
268
-
269
-
270
-
271
-
272
-
273
-
274
-
275
-
276
 |
 |

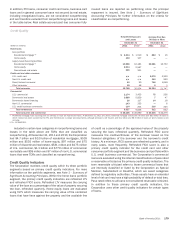
172 Bank of America 2011
adjustment. All or a portion of these counterparty credit valuation
adjustments are subsequently adjusted due to changes in the
value of the derivative contract, collateral and creditworthiness of
the counterparties. During 2011 and 2010, credit valuation gains
(losses) of $(1.9) billion and $731 million ($(606) million and $(8)
million, net of hedges) for counterparty credit risk related to
derivative assets were recognized in trading account profits. These
credit valuation adjustments were primarily related to the
Corporation’s monoline exposure. At December 31, 2011 and
2010, the cumulative counterparty credit risk valuation adjustment
reduced the derivative assets balance by $2.8 billion and $6.8
billion.
In addition, the fair value of the Corporation’s or its
subsidiaries’ derivative liabilities is adjusted to reflect the impact
of the Corporation’s credit quality. During 2011 and 2010, the
Corporation recorded DVA gains of $1.4 billion and $331 million
($1.0 billion and $262 million, net of interest rate and foreign
exchange hedges) in trading account profits for changes in the
Corporation’s or its subsidiaries’ credit risk. At December 31,
2011 and 2010, the Corporation’s cumulative DVA reduced the
derivative liabilities balance by $2.4 billion and $1.1 billion.
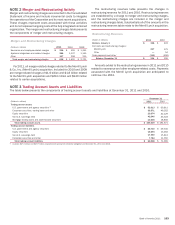
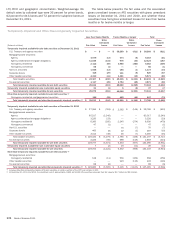
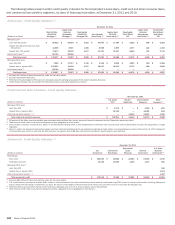
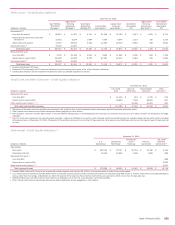
NOTE 5 Securities
The table below presents the amortized cost, gross unrealized gains and losses in accumulated OCI, and fair value of debt and
marketable equity securities at December 31, 2011 and 2010.
(Dollars in millions)
Available-for-sale debt securities, December 31, 2011
U.S. Treasury and agency securities
Mortgage-backed securities:
Agency
Agency collateralized mortgage obligations
Non-agency residential (1)
Non-agency commercial
Non-U.S. securities
Corporate bonds
Other taxable securities, substantially all ABS
Total taxable securities
Tax-exempt securities
Total available-for-sale debt securities
Held-to-maturity debt securities (2)
Total debt securities
Available-for-sale marketable equity securities (3)
Available-for-sale debt securities, December 31, 2010
U.S. Treasury and agency securities
Mortgage-backed securities:
Agency
Agency collateralized mortgage obligations
Non-agency residential (1)
Non-agency commercial
Non-U.S. securities
Corporate bonds
Other taxable securities, substantially all ABS
Total taxable securities
Tax-exempt securities
Total available-for-sale debt securities
Held-to-maturity debt securities (2)
Total debt securities
Available-for-sale marketable equity securities (3)
Amortized
Cost
$ 43,433
138,073
44,392
14,948
4,894
4,872
2,993
12,889
266,494
4,678
$ 271,172
35,265
$ 306,437
$65
$ 49,413
190,409
36,639
23,458
6,167
4,054
5,157
15,514
330,811
5,687
$ 336,498
427
$ 336,925
$ 8,650
Gross
Unrealized
Gains
$242
4,511
774
301
629
62
79
49
6,647
15
$ 6,662
181
$ 6,843
$10
$ 604
3,048
401
588
686
92
144
39
5,602
32
$ 5,634
—
$ 5,634
$ 10,628
Gross
Unrealized
Losses
$(811)
(21)
(167)
(482)
(1)
(14)
(37)
(60)
(1,593)
(90)
$(1,683)
(4)
$(1,687)
$(7)
$ (912)
(2,240)
(23)
(929)
(1)
(7)
(10)
(161)
(4,283)
(222)
$ (4,505)
—
$ (4,505)
$ (13)
Fair Value
$ 42,864
142,563
44,999
14,767
5,522
4,920
3,035
12,878
271,548
4,603
$276,151
35,442
$ 311,593
$68
$ 49,105
191,217
37,017
23,117
6,852
4,139
5,291
15,392
332,130
5,497
$ 337,627
427
$ 338,054
$ 19,265
(1) At December 31, 2011 and 2010, includes approximately 89 percent and 90 percent prime bonds, nine percent and eight percent Alt-A bonds and two percent subprime bonds.
(2) Substantially all U.S. agency securities.
(3) Classified in other assets on the Corporation’s Consolidated Balance Sheet.