Bank of America 2011 Annual Report Download - page 98
Download and view the complete annual report
Please find page 98 of the 2011 Bank of America annual report below. You can navigate through the pages in the report by either clicking on the pages listed below, or by using the keyword search tool below to find specific information within the annual report.-
 1
1 -
2
-
3
-
4
-
5
-
6
-
7
-
8
-
9
-
10
-
11
-
12
-
13
-
14
-
15
-
16
-
17
-
18
-
19
-
20
-
21
-
22
-
23
-
24
-
25
-
26
-
27
-
28
-
29
-
30
-
31
-
32
-
33
-
34
-
35
-
36
-
37
-
38
-
39
-
40
-
41
-
42
-
43
-
44
-
45
-
46
-
47
-
48
-
49
-
50
-
51
-
52
-
53
-
54
-
55
-
56
-
57
-
58
-
59
-
60
-
61
-
62
-
63
-
64
-
65
-
66
-
67
-
68
-
69
-
70
-
71
-
72
-
73
-
74
-
75
-
76
-
77
-
78
-
79
-
80
-
81
-
82
-
83
-
84
-
85
-
86
-
87
-
 88
88 -
 89
89 -
 90
90 -
 91
91 -
 92
92 -
 93
93 -
 94
94 -
 95
95 -
 96
96 -
 97
97 -
 98
98 -
 99
99 -
 100
100 -
 101
101 -
 102
102 -
 103
103 -
 104
104 -
 105
105 -
 106
106 -
 107
107 -
 108
108 -
109
-
110
-
111
-
112
-
113
-
114
-
115
-
116
-
117
-
118
-
119
-
120
-
121
-
122
-
123
-
124
-
125
-
126
-
127
-
128
-
129
-
130
-
131
-
132
-
133
-
134
-
135
-
136
-
137
-
138
-
139
-
140
-
141
-
142
-
143
-
144
-
145
-
146
-
147
-
148
-
149
-
150
-
151
-
152
-
153
-
154
-
155
-
156
-
157
-
158
-
159
-
160
-
161
-
162
-
163
-
164
-
165
-
166
-
167
-
168
-
169
-
170
-
171
-
172
-
173
-
174
-
175
-
176
-
177
-
178
-
179
-
180
-
181
-
182
-
183
-
184
-
185
-
186
-
187
-
188
-
189
-
190
-
191
-
192
-
193
-
194
-
195
-
196
-
197
-
198
-
199
-
200
-
201
-
202
-
203
-
204
-
205
-
206
-
207
-
208
-
209
-
210
-
211
-
212
-
213
-
214
-
215
-
216
-
217
-
218
-
219
-
220
-
221
-
222
-
223
-
224
-
225
-
226
-
227
-
228
-
229
-
230
-
231
-
232
-
233
-
234
-
235
-
236
-
237
-
238
-
239
-
240
-
241
-
242
-
243
-
244
-
245
-
246
-
247
-
248
-
249
-
250
-
251
-
252
-
253
-
254
-
255
-
256
-
257
-
258
-
259
-
260
-
261
-
262
-
263
-
264
-
265
-
266
-
267
-
268
-
269
-
270
-
271
-
272
-
273
-
274
-
275
-
276
 |
 |

96 Bank of America 2011
During 2011, we terminated all of our monoline contracts
referencing super senior ABS CDOs and reclassified net monoline
exposure with a carrying value of $1.3 billion ($4.7 billion gross
receivable less impairment) at December 31, 2011 from derivative
assets to other assets because of the inherent default risk.
Because these contracts no longer provide a hedge benefit, they
are no longer considered derivative trading instruments. This
exposure relates to a single counterparty and is recorded at fair
value based on current net recovery projections. The net recovery
projections take into account the present value of projected
payments expected to be received from the counterparty.
Monoline derivative credit exposure had a notional value of
$21.1 billion and $38.4 billion at December 31, 2011 and 2010.
Mark-to-market monoline derivative credit exposure was $1.8
billion and $9.2 billion at December 31, 2011 and 2010 with the
decrease driven by positive valuation adjustments on legacy
assets, terminated monoline contracts and the reclassification of
net monoline exposure to other assets mentioned above. The
counterparty credit valuation adjustment related to monoline
derivative exposure was $417 million and $5.3 billion at
December 31, 2011 and 2010. This adjustment reduced our net
mark-to-market exposure to $1.3 billion at December 31, 2011
compared to $3.9 billion at December 31, 2010 and covered 24
percent of the mark-to-market exposure at December 31, 2011,
down from 57 percent at December 31, 2010. We do not hold
collateral against these derivative exposures. For more information
on our monoline exposure, termination of certain monoline
contracts and the transfer of monoline exposure to other assets,
see GBAM on page 43.
We also have indirect exposure to monolines as we invest in
securities where the issuers have purchased wraps. For example,
municipalities and corporations purchase insurance in order to
reduce their cost of borrowing. If the rating agencies downgrade
the monolines, the credit rating of the bond may fall and may have
an adverse impact on the market value of the security. In the case
of default, we first look to the underlying securities and then to
the purchased insurance for recovery. Investments in securities
with purchased wraps issued by municipalities and corporations
had a notional amount of $150 million and $2.4 billion at
December 31, 2011 and 2010. Mark-to-market investment
exposure was $89 million at December 31, 2011 compared to
$2.2 billion at December 31, 2010.
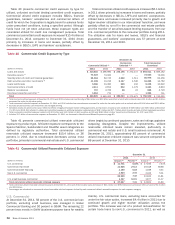
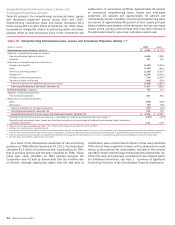
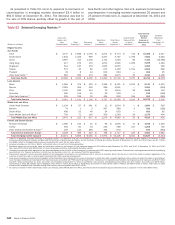
Table 47
(Dollars in millions)
Diversified financials
Real estate (2)
Government and public education
Healthcare equipment and services
Capital goods
Retailing
Banks
Consumer services
Materials
Energy
Commercial services and supplies
Food, beverage and tobacco
Utilities
Media
Transportation
Individuals and trusts
Insurance, including monolines
Technology hardware and equipment
Pharmaceuticals and biotechnology
Religious and social organizations
Telecommunication services
Software and services
Consumer durables and apparel
Automobiles and components
Food and staples retailing
Other
Total commercial credit exposure by industry
Net credit default protection purchased on total commitments (3)
Commercial Credit Exposure by Industry (1)
December 31
Commercial Utilized
2011
$ 64,957
48,138
43,090
31,298
24,025
25,478
35,231
24,445
19,384
15,151
20,089
15,904
8,102
11,447
12,683
14,993
10,090
5,247
4,141
8,536
4,297
4,304
4,505
2,813
3,273
4,888
$ 466,509
2010
$ 58,698
58,531
44,131
30,420
21,940
24,660
26,831
24,759
15,873
9,765
20,056
14,777
6,990
11,611
12,070
18,316
17,263
4,373
3,859
8,409
3,823
3,837
4,297
2,090
3,222
9,821
$460,422
Total Commercial
Committed
2011
$94,969
62,566
57,021
48,141
48,013
46,290
38,735
38,498
38,070
32,074
30,831
30,501
24,552
21,158
19,036
19,001
16,157
12,173
11,328
11,160
10,424
9,579
8,965
7,178
6,476
7,636
$ 750,532
$ (19,356)
2010
$ 86,750
72,004
59,594
47,569
46,087
43,950
29,667
39,694
33,046
26,328
30,517
28,126
24,207
20,619
18,436
22,937
24,417
10,932
11,009
10,823
9,321
9,531
8,836
5,941
6,161
13,593
$ 740,095
$ (20,118)
(1) Includes U.S. small business commercial exposure.
(2) Industries are viewed from a variety of perspectives to best isolate the perceived risks. For purposes of this table, the real estate industry is defined based on the borrowers’ or counterparties’
primary business activity using operating cash flows and primary source of repayment as key factors.
(3) Represents net notional credit protection purchased. See Risk Mitigation below for additional information.