Bank of America 2011 Annual Report Download - page 178
Download and view the complete annual report
Please find page 178 of the 2011 Bank of America annual report below. You can navigate through the pages in the report by either clicking on the pages listed below, or by using the keyword search tool below to find specific information within the annual report.-
 1
1 -
2
-
3
-
4
-
5
-
6
-
7
-
8
-
9
-
10
-
11
-
12
-
13
-
14
-
15
-
16
-
17
-
18
-
19
-
20
-
21
-
22
-
23
-
24
-
25
-
26
-
27
-
28
-
29
-
30
-
31
-
32
-
33
-
34
-
35
-
36
-
37
-
38
-
39
-
40
-
41
-
42
-
43
-
44
-
45
-
46
-
47
-
48
-
49
-
50
-
51
-
52
-
53
-
54
-
55
-
56
-
57
-
58
-
59
-
60
-
61
-
62
-
63
-
64
-
65
-
66
-
67
-
68
-
69
-
70
-
71
-
72
-
73
-
74
-
75
-
76
-
77
-
78
-
79
-
80
-
81
-
82
-
83
-
84
-
85
-
86
-
87
-
88
-
89
-
90
-
91
-
92
-
93
-
94
-
95
-
96
-
97
-
98
-
99
-
100
-
101
-
102
-
103
-
104
-
105
-
106
-
107
-
108
-
109
-
110
-
111
-
112
-
113
-
114
-
115
-
116
-
117
-
118
-
119
-
120
-
121
-
122
-
123
-
124
-
125
-
126
-
127
-
128
-
129
-
130
-
131
-
132
-
133
-
134
-
135
-
136
-
137
-
138
-
139
-
140
-
141
-
142
-
143
-
144
-
145
-
146
-
147
-
148
-
149
-
150
-
151
-
152
-
153
-
154
-
155
-
156
-
157
-
158
-
159
-
160
-
161
-
162
-
163
-
164
-
165
-
166
-
167
-
 168
168 -
 169
169 -
 170
170 -
 171
171 -
 172
172 -
 173
173 -
 174
174 -
 175
175 -
 176
176 -
 177
177 -
 178
178 -
 179
179 -
 180
180 -
 181
181 -
 182
182 -
 183
183 -
 184
184 -
 185
185 -
 186
186 -
 187
187 -
 188
188 -
189
-
190
-
191
-
192
-
193
-
194
-
195
-
196
-
197
-
198
-
199
-
200
-
201
-
202
-
203
-
204
-
205
-
206
-
207
-
208
-
209
-
210
-
211
-
212
-
213
-
214
-
215
-
216
-
217
-
218
-
219
-
220
-
221
-
222
-
223
-
224
-
225
-
226
-
227
-
228
-
229
-
230
-
231
-
232
-
233
-
234
-
235
-
236
-
237
-
238
-
239
-
240
-
241
-
242
-
243
-
244
-
245
-
246
-
247
-
248
-
249
-
250
-
251
-
252
-
253
-
254
-
255
-
256
-
257
-
258
-
259
-
260
-
261
-
262
-
263
-
264
-
265
-
266
-
267
-
268
-
269
-
270
-
271
-
272
-
273
-
274
-
275
-
276
 |
 |

176 Bank of America 2011
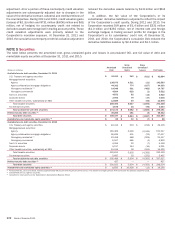
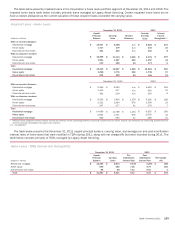
The gross realized gains and losses on sales of AFS debt
securities for 2011, 2010 and 2009 are presented in the table
below.
Gains and Losses on Sales of AFS Debt Securities
(Dollars in millions)
Gross gains
Gross losses
Net gains on sales of AFS debt securities
Income tax expense attributable to realized
net gains on sales of AFS debt securities
2011
$ 3,685
(311)
$ 3,374
$ 1,248
2010
$ 3,995
(1,469)
$ 2,526
$ 935
2009
$ 5,047
(324)
$ 4,723
$ 1,748
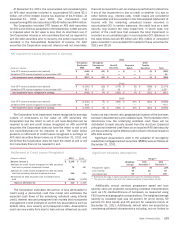
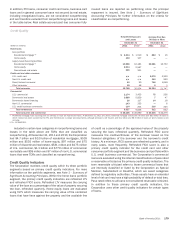
Certain Corporate and Strategic Investments
At December 31, 2011 and 2010, the Corporation owned 2.0
billion shares and 25.6 billion shares representing approximately
one percent and 10 percent of China Construction Bank
Corporation (CCB). During 2011, the Corporation sold shares of
CCB and in connection therewith recorded gains of $6.5 billion.
Sales restrictions on the remaining 2.0 billion CCB shares continue
until August 2013 and accordingly these shares are carried at
cost. At December 31, 2011 and 2010, the cost basis of the
Corporation’s total investment in CCB was $716 million and $9.2
billion, the carrying value was $716 million and $19.7 billion and
the fair value was $1.4 billion and $20.8 billion. This investment
is recorded in other assets. Dividend income on this investment
is recorded in equity investment income and during 2011 and
2010, the Corporation recorded dividends of $836 million and
$535 million from CCB. The strategic assistance agreement
between the Corporation and CCB, which includes cooperation in
specific business areas, remains in place.
During 2011, the Corporation sold its remaining ownership
interest of approximately 13.6 million preferred shares, or seven
percent of BlackRock, Inc. The investment was recorded in other
assets at cost. In connection with the sale, the Corporation
recorded a gain of $377 million.
During 2011, the Corporation recorded $1.1 billion of
impairment charges on its investment in a merchant services joint
venture. The joint venture had a carrying value of $3.4 billion and
$4.7 billion at December 31, 2011 and 2010 with the reduction
in carrying value primarily the result of the impairment charges.
The impairment charges were based on the ongoing financial
performance of the joint venture and updated forecasts of its long-
term financial performance. For additional information, see Note
14 – Commitments and Contingencies.