Bank of America 2011 Annual Report Download - page 255
Download and view the complete annual report
Please find page 255 of the 2011 Bank of America annual report below. You can navigate through the pages in the report by either clicking on the pages listed below, or by using the keyword search tool below to find specific information within the annual report.-
 1
1 -
2
-
3
-
4
-
5
-
6
-
7
-
8
-
9
-
10
-
11
-
12
-
13
-
14
-
15
-
16
-
17
-
18
-
19
-
20
-
21
-
22
-
23
-
24
-
25
-
26
-
27
-
28
-
29
-
30
-
31
-
32
-
33
-
34
-
35
-
36
-
37
-
38
-
39
-
40
-
41
-
42
-
43
-
44
-
45
-
46
-
47
-
48
-
49
-
50
-
51
-
52
-
53
-
54
-
55
-
56
-
57
-
58
-
59
-
60
-
61
-
62
-
63
-
64
-
65
-
66
-
67
-
68
-
69
-
70
-
71
-
72
-
73
-
74
-
75
-
76
-
77
-
78
-
79
-
80
-
81
-
82
-
83
-
84
-
85
-
86
-
87
-
88
-
89
-
90
-
91
-
92
-
93
-
94
-
95
-
96
-
97
-
98
-
99
-
100
-
101
-
102
-
103
-
104
-
105
-
106
-
107
-
108
-
109
-
110
-
111
-
112
-
113
-
114
-
115
-
116
-
117
-
118
-
119
-
120
-
121
-
122
-
123
-
124
-
125
-
126
-
127
-
128
-
129
-
130
-
131
-
132
-
133
-
134
-
135
-
136
-
137
-
138
-
139
-
140
-
141
-
142
-
143
-
144
-
145
-
146
-
147
-
148
-
149
-
150
-
151
-
152
-
153
-
154
-
155
-
156
-
157
-
158
-
159
-
160
-
161
-
162
-
163
-
164
-
165
-
166
-
167
-
168
-
169
-
170
-
171
-
172
-
173
-
174
-
175
-
176
-
177
-
178
-
179
-
180
-
181
-
182
-
183
-
184
-
185
-
186
-
187
-
188
-
189
-
190
-
191
-
192
-
193
-
194
-
195
-
196
-
197
-
198
-
199
-
200
-
201
-
202
-
203
-
204
-
205
-
206
-
207
-
208
-
209
-
210
-
211
-
212
-
213
-
214
-
215
-
216
-
217
-
218
-
219
-
220
-
221
-
222
-
223
-
224
-
225
-
226
-
227
-
228
-
229
-
230
-
231
-
232
-
233
-
234
-
235
-
236
-
237
-
238
-
239
-
240
-
241
-
242
-
243
-
244
-
 245
245 -
 246
246 -
 247
247 -
 248
248 -
 249
249 -
 250
250 -
 251
251 -
 252
252 -
 253
253 -
 254
254 -
 255
255 -
 256
256 -
 257
257 -
 258
258 -
 259
259 -
 260
260 -
 261
261 -
 262
262 -
 263
263 -
 264
264 -
 265
265 -
266
-
267
-
268
-
269
-
270
-
271
-
272
-
273
-
274
-
275
-
276
 |
 |

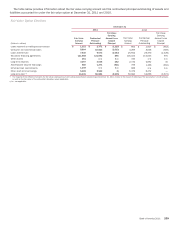
Bank of America 2011 253
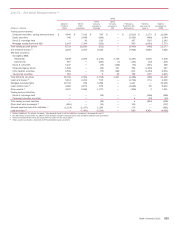
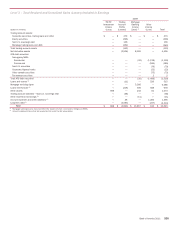
Level 3 – Fair Value Measurements (1)
(Dollars in millions)
Trading account assets:
Corporate securities, trading loans and other
Equity securities
Non-U.S. sovereign debt
Mortgage trading loans and ABS
Total trading account assets
Net derivative assets (2)
AFS debt securities:
Non-agency MBS:
Residential
Commercial
Non-U.S. securities
Corporate/Agency bonds
Other taxable securities
Tax-exempt securities
Total AFS debt securities
Loans and leases (3)
Mortgage servicing rights
Loans held-for-sale (3)
Other assets (4)
Trading account liabilities:
Non-U.S. sovereign debt
Corporate securities and other
Total trading account liabilities
Other short-term borrowings (3)
Accrued expenses and other liabilities (3)
Long-term debt (3)
2009
Balance
January 1
2009
$ 4,540
546
—
1,647
6,733
2,270
5,439
657
1,247
1,598
9,599
162
18,702
5,413
12,733
3,382
4,157
—
—
—
(816)
(1,124)
—
Merrill
Lynch
Acquisition
$ 7,012
3,848
30
7,294
18,184
2,307
2,509
—
—
—
—
—
2,509
2,452
209
3,872
2,696
—
—
—
—
(1,337)
(7,481)
Gains
(Losses)
Included in
Earnings
$ 370
(396)
136
(262)
(152)
5,526
(1,159)
(185)
(79)
(22)
(75)
2
(1,518)
515
5,286
678
1,273
(38)
—
(38)
(11)
1,396
(2,310)
Gains
(Losses)
Included in
OCI
$—
—
—
—
—
—
2,738
(7)
(226)
127
669
26
3,327
—
—
—
—
—
—
—
—
—
—
Purchases,
Issuances and
Settlements
$ (2,015)
(2,425)
167
933
(3,340)
(7,906)
(4,187)
(155)
(73)
324
815
788
(2,488)
(3,718)
1,237
(1,048)
(308)
—
4
4
120
174
830
Transfers
into/(out of)
Level 3
$ 1,173
(489)
810
(1,842)
(348)
5,666
1,876
(52)
(401)
(1,100)
(1,154)
645
(186)
274
—
58
3
(348)
(14)
(362)
—
—
4,301
Balance
December 31
2009
$ 11,080
1,084
1,143
7,770
21,077
7,863
7,216
258
468
927
9,854
1,623
20,346
4,936
19,465
6,942
7,821
(386)
(10)
(396)
(707)
(891)
(4,660)
(1) Assets (liabilities). For assets, increase / (decrease) to Level 3 and for liabilities, (increase) / decrease to Level 3.
(2) Net derivatives at December 31, 2009 include derivative assets of $23.0 billion and derivative liabilities of $15.2 billion.
(3) Amounts represent items that are accounted for under the fair value option.
(4) Other assets is primarily comprised of AFS marketable equity securities.