Bank of America 2011 Annual Report Download - page 265
Download and view the complete annual report
Please find page 265 of the 2011 Bank of America annual report below. You can navigate through the pages in the report by either clicking on the pages listed below, or by using the keyword search tool below to find specific information within the annual report.-
 1
1 -
2
-
3
-
4
-
5
-
6
-
7
-
8
-
9
-
10
-
11
-
12
-
13
-
14
-
15
-
16
-
17
-
18
-
19
-
20
-
21
-
22
-
23
-
24
-
25
-
26
-
27
-
28
-
29
-
30
-
31
-
32
-
33
-
34
-
35
-
36
-
37
-
38
-
39
-
40
-
41
-
42
-
43
-
44
-
45
-
46
-
47
-
48
-
49
-
50
-
51
-
52
-
53
-
54
-
55
-
56
-
57
-
58
-
59
-
60
-
61
-
62
-
63
-
64
-
65
-
66
-
67
-
68
-
69
-
70
-
71
-
72
-
73
-
74
-
75
-
76
-
77
-
78
-
79
-
80
-
81
-
82
-
83
-
84
-
85
-
86
-
87
-
88
-
89
-
90
-
91
-
92
-
93
-
94
-
95
-
96
-
97
-
98
-
99
-
100
-
101
-
102
-
103
-
104
-
105
-
106
-
107
-
108
-
109
-
110
-
111
-
112
-
113
-
114
-
115
-
116
-
117
-
118
-
119
-
120
-
121
-
122
-
123
-
124
-
125
-
126
-
127
-
128
-
129
-
130
-
131
-
132
-
133
-
134
-
135
-
136
-
137
-
138
-
139
-
140
-
141
-
142
-
143
-
144
-
145
-
146
-
147
-
148
-
149
-
150
-
151
-
152
-
153
-
154
-
155
-
156
-
157
-
158
-
159
-
160
-
161
-
162
-
163
-
164
-
165
-
166
-
167
-
168
-
169
-
170
-
171
-
172
-
173
-
174
-
175
-
176
-
177
-
178
-
179
-
180
-
181
-
182
-
183
-
184
-
185
-
186
-
187
-
188
-
189
-
190
-
191
-
192
-
193
-
194
-
195
-
196
-
197
-
198
-
199
-
200
-
201
-
202
-
203
-
204
-
205
-
206
-
207
-
208
-
209
-
210
-
211
-
212
-
213
-
214
-
215
-
216
-
217
-
218
-
219
-
220
-
221
-
222
-
223
-
224
-
225
-
226
-
227
-
228
-
229
-
230
-
231
-
232
-
233
-
234
-
235
-
236
-
237
-
238
-
239
-
240
-
241
-
242
-
243
-
244
-
245
-
246
-
247
-
248
-
249
-
250
-
251
-
252
-
253
-
254
-
 255
255 -
 256
256 -
 257
257 -
 258
258 -
 259
259 -
 260
260 -
 261
261 -
 262
262 -
 263
263 -
 264
264 -
 265
265 -
 266
266 -
 267
267 -
 268
268 -
 269
269 -
 270
270 -
 271
271 -
 272
272 -
 273
273 -
 274
274 -
 275
275 -
276
 |
 |
Bank of America 2011 263
firms and governments, and are generally defined as companies
with sales up to $2 billion. Lending products and services include
commercial loans and commitment facilities, real estate lending,
asset-based lending and indirect consumer loans. Capital
management and treasury solutions include treasury
management, foreign exchange and short-term investing options.
In 2011, management responsibility for the merchant services
joint venture was moved from GBAM to Global Commercial Banking.
Prior periods have been reclassified to reflect the change.
Global Banking & Markets
GBAM provides advisory services, financing, securities clearing,
settlement and custody services globally to institutional investor
clients in support of their investing and trading activities. GBAM
also works with commercial and corporate clients to provide debt
and equity underwriting and distribution capabilities, merger-
related and other advisory services, and risk management
products using interest rate, equity, credit, currency and commodity
derivatives, foreign exchange, fixed-income and mortgage-related
products. As a result of the Corporation’s market-making activities
in these products, it may be required to manage positions in
government securities, equity and equity-linked securities, high-
grade and high-yield corporate debt securities, commercial paper,
MBS and ABS. Corporate banking services provide a wide range
of lending-related products and services, integrated working
capital management and treasury solutions to clients through the
Corporation’s network of offices and client relationship teams
along with various product partners. Corporate clients are generally
defined as companies with annual sales greater than $2 billion.
Global Wealth & Investment Management
GWIM provides comprehensive wealth management capabilities
to a broad base of clients from emerging affluent to the ultra-high-
net-worth. These services include investment and brokerage
services, estate and financial planning, fiduciary portfolio
management, cash and liability management and specialty asset
management. GWIM also provides retirement and benefit plan
services, philanthropic management and asset management to
individual and institutional clients. GWIM results are impacted by
the migration of clients and their related deposit and loan balances
to or from Deposits, CRES and the ALM portfolio. Migration in the
current year includes the additional movement of balances to
Merrill Edge, which is in Deposits. Subsequent to the date of
migration, the associated net interest income, noninterest income
and noninterest expense are recorded in the business to which
the clients migrated.
All Other
All Other consists of equity investment activities including Global
Principal Investments, Strategic and other investments, and
Corporate Investments. All Other also includes liquidating
businesses, merger and restructuring charges, ALM functions such
as residential mortgage portfolio and investment securities and
related activities, including economic hedges and gains/losses on
structured liabilities, the impact of certain allocation
methodologies and accounting hedge ineffectiveness. Additionally,
All Other includes certain residential mortgage and discontinued
real estate loans that are managed by CRES. During 2011, the
Corporation sold its Canadian consumer card business and is
evaluating its remaining international consumer card operations.
As a result of these actions, the international consumer card
business results were moved to All Other from Card Services and
prior periods have been reclassified.
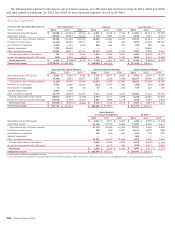
Basis of Presentation
The management accounting and reporting process derives
segment and business results by utilizing allocation
methodologies for revenue and expense. The net income derived
for the businesses is dependent upon revenue and cost allocations
using an activity-based costing model, funds transfer pricing, and
other methodologies and assumptions management believes are
appropriate to reflect the results of the business.
Total revenue, net of interest expense, includes net interest
income on a fully taxable-equivalent (FTE) basis and noninterest
income. The adjustment of net interest income to a FTE basis
results in a corresponding increase in income tax expense. The
segment results also reflect certain revenue and expense
methodologies that are utilized to determine net income. The net
interest income of the businesses includes the results of a funds
transfer pricing process that matches assets and liabilities with
similar interest rate sensitivity and maturity characteristics. For
presentation purposes, in segments where the total of liabilities
and equity exceeds assets, which are generally deposit-taking
segments, the Corporation allocates assets to match liabilities.
Net interest income of the business segments also includes an
allocation of net interest income generated by the Corporation’s
ALM activities.
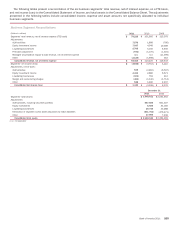
The Corporation’s ALM activities include an overall interest rate
risk management strategy that incorporates the use of interest
rate contracts to manage fluctuations in earnings that are caused
by interest rate volatility. The Corporation’s goal is to manage
interest rate sensitivity so that movements in interest rates do not
significantly adversely affect earnings and capital. The majority of
the Corporation’s ALM activities are allocated to the business
segments and fluctuate based on performance. ALM activities
include external product pricing decisions including deposit pricing
strategies, the effects of the Corporation’s internal funds transfer
pricing process and the net effects of other ALM activities.
Certain expenses not directly attributable to a specific
business segment are allocated to the segments. The most
significant of these expenses include data and item processing
costs and certain centralized or shared functions. Data processing
costs are allocated to the segments based on equipment usage.
Item processing costs are allocated to the segments based on
the volume of items processed for each segment. The costs of
certain centralized or shared functions are allocated based on
methodologies that reflect utilization.